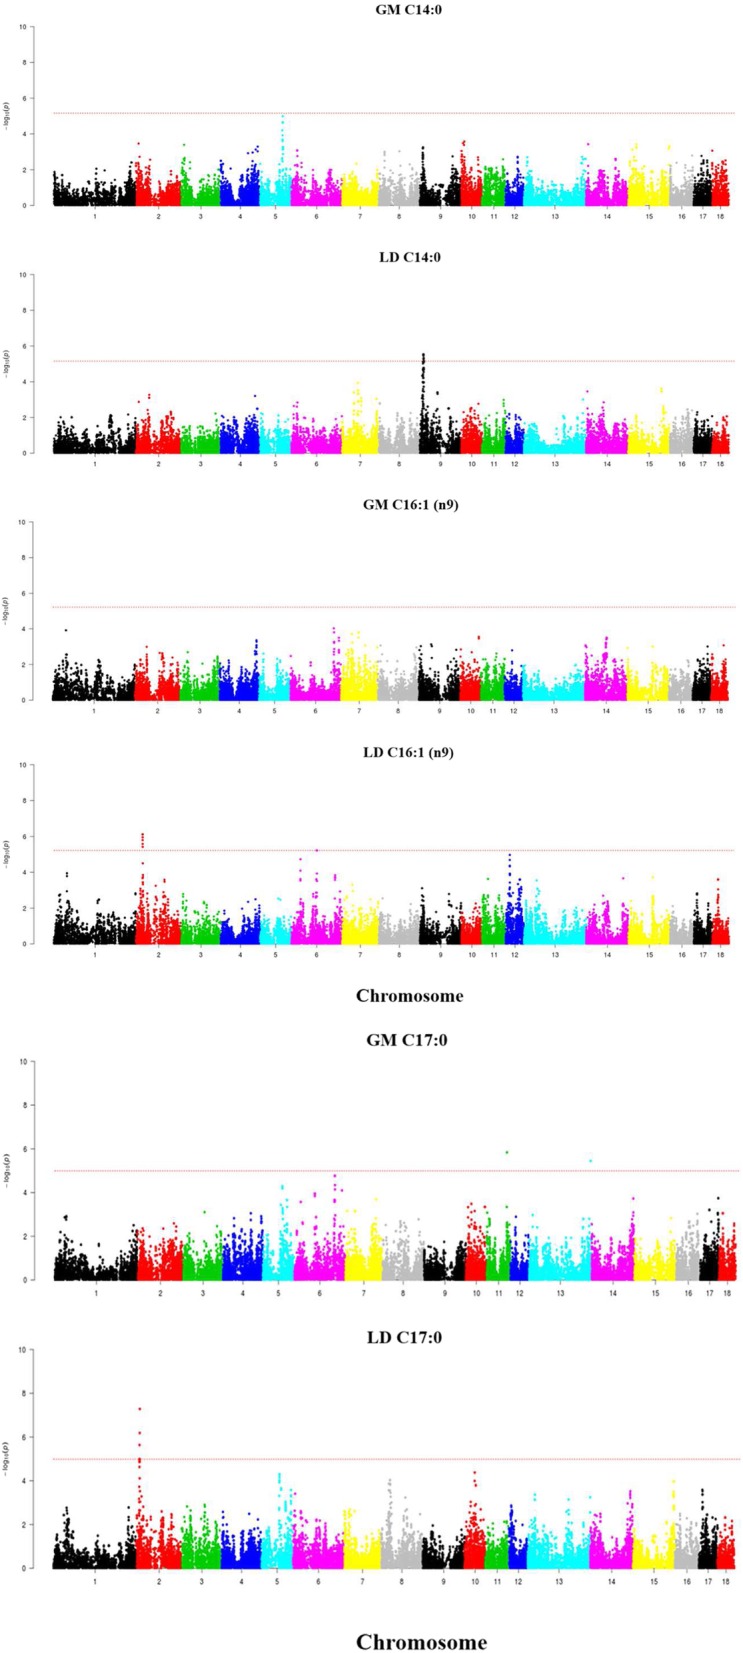
Fig. 4.

Manhattan plots depicting the genome-wide significant associations between SNPs and C14:0, C16:1(n-9) and C17:0 fatty acid contents in the gluteus medius (GM) and longissimus dorsi (LD) muscles of Duroc pigs. Negative log10 P-values of the associations between SNPs and phenotypes are plotted against the genomic location of each SNP. Markers on different chromosomes are denoted by different colors. The dashed line represents the genome-wide threshold of significance (q-value ≤0.05). It can be seen that SNPs at SSC2 (C16:1 and C17:0) and SSC9 (C14:0) display significant associations with FA composition traits recorded in the LD muscle but not in the GM one
