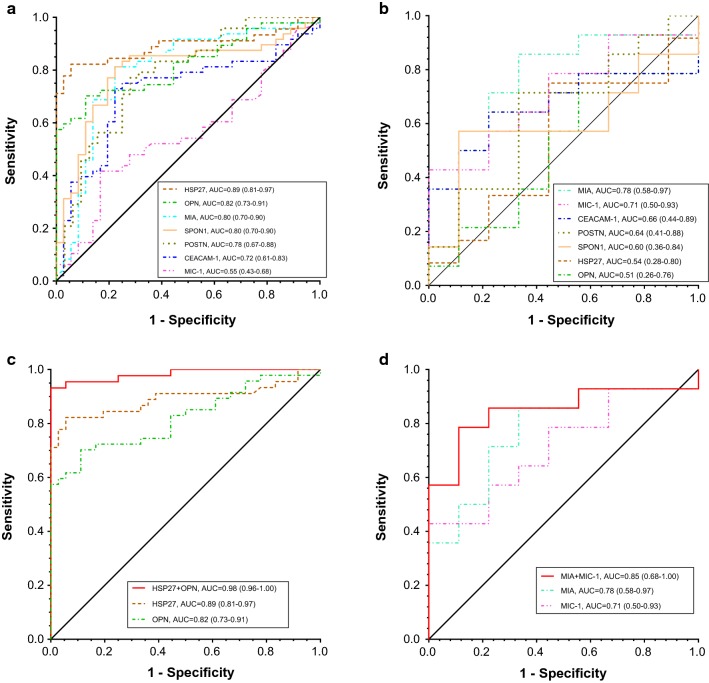
Fig. 5.
Diagnostic performance of serum biomarkers individually and combination for the detection of UM. a and c Receiver operator characteristics (ROC) curves for OPN, MIA, CEACAM-1, MIC-1, SPON1, POSTN, and HSP27 as individual markers and HSP27 and OPN combined for UM patients versus healthy controls. b and d ROC curves for OPN, MIA, CEACAM-1, MIC-1, SPON1, POSTN, and HSP27 as individual markers and MIA and MIC-1 combined for metastatic UM versus DF (≥ 5 years). The area under the curve (AUC) for each marker or panel is presented along with its 95% confidence interval in brackets

