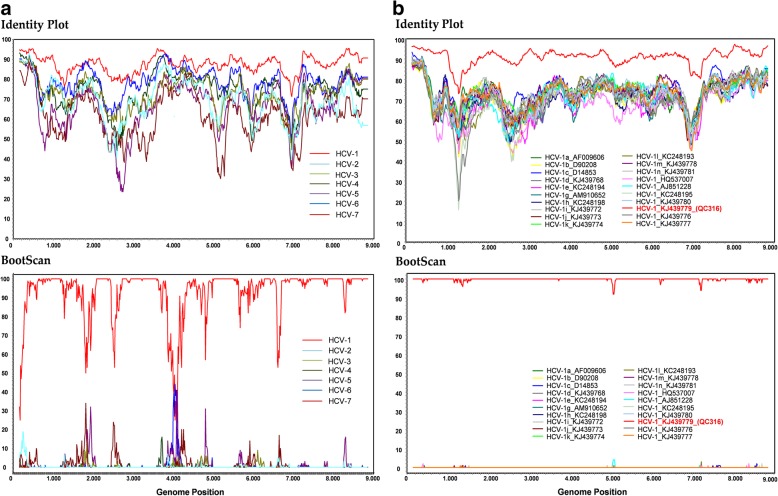
Fig. 2.
Analysis of potential recombination events of the DE/17–0414. Identity Plot and BootScan analyses of (a) HCV genotypes and (b) HCV-1 subtypes. All analyses were performed with a window of 300 nt and a step size of 15 nt under Kimura 2-parameter model. Positions containing gaps were stripped from the alignment. QC316 is highlighted in bold and red

