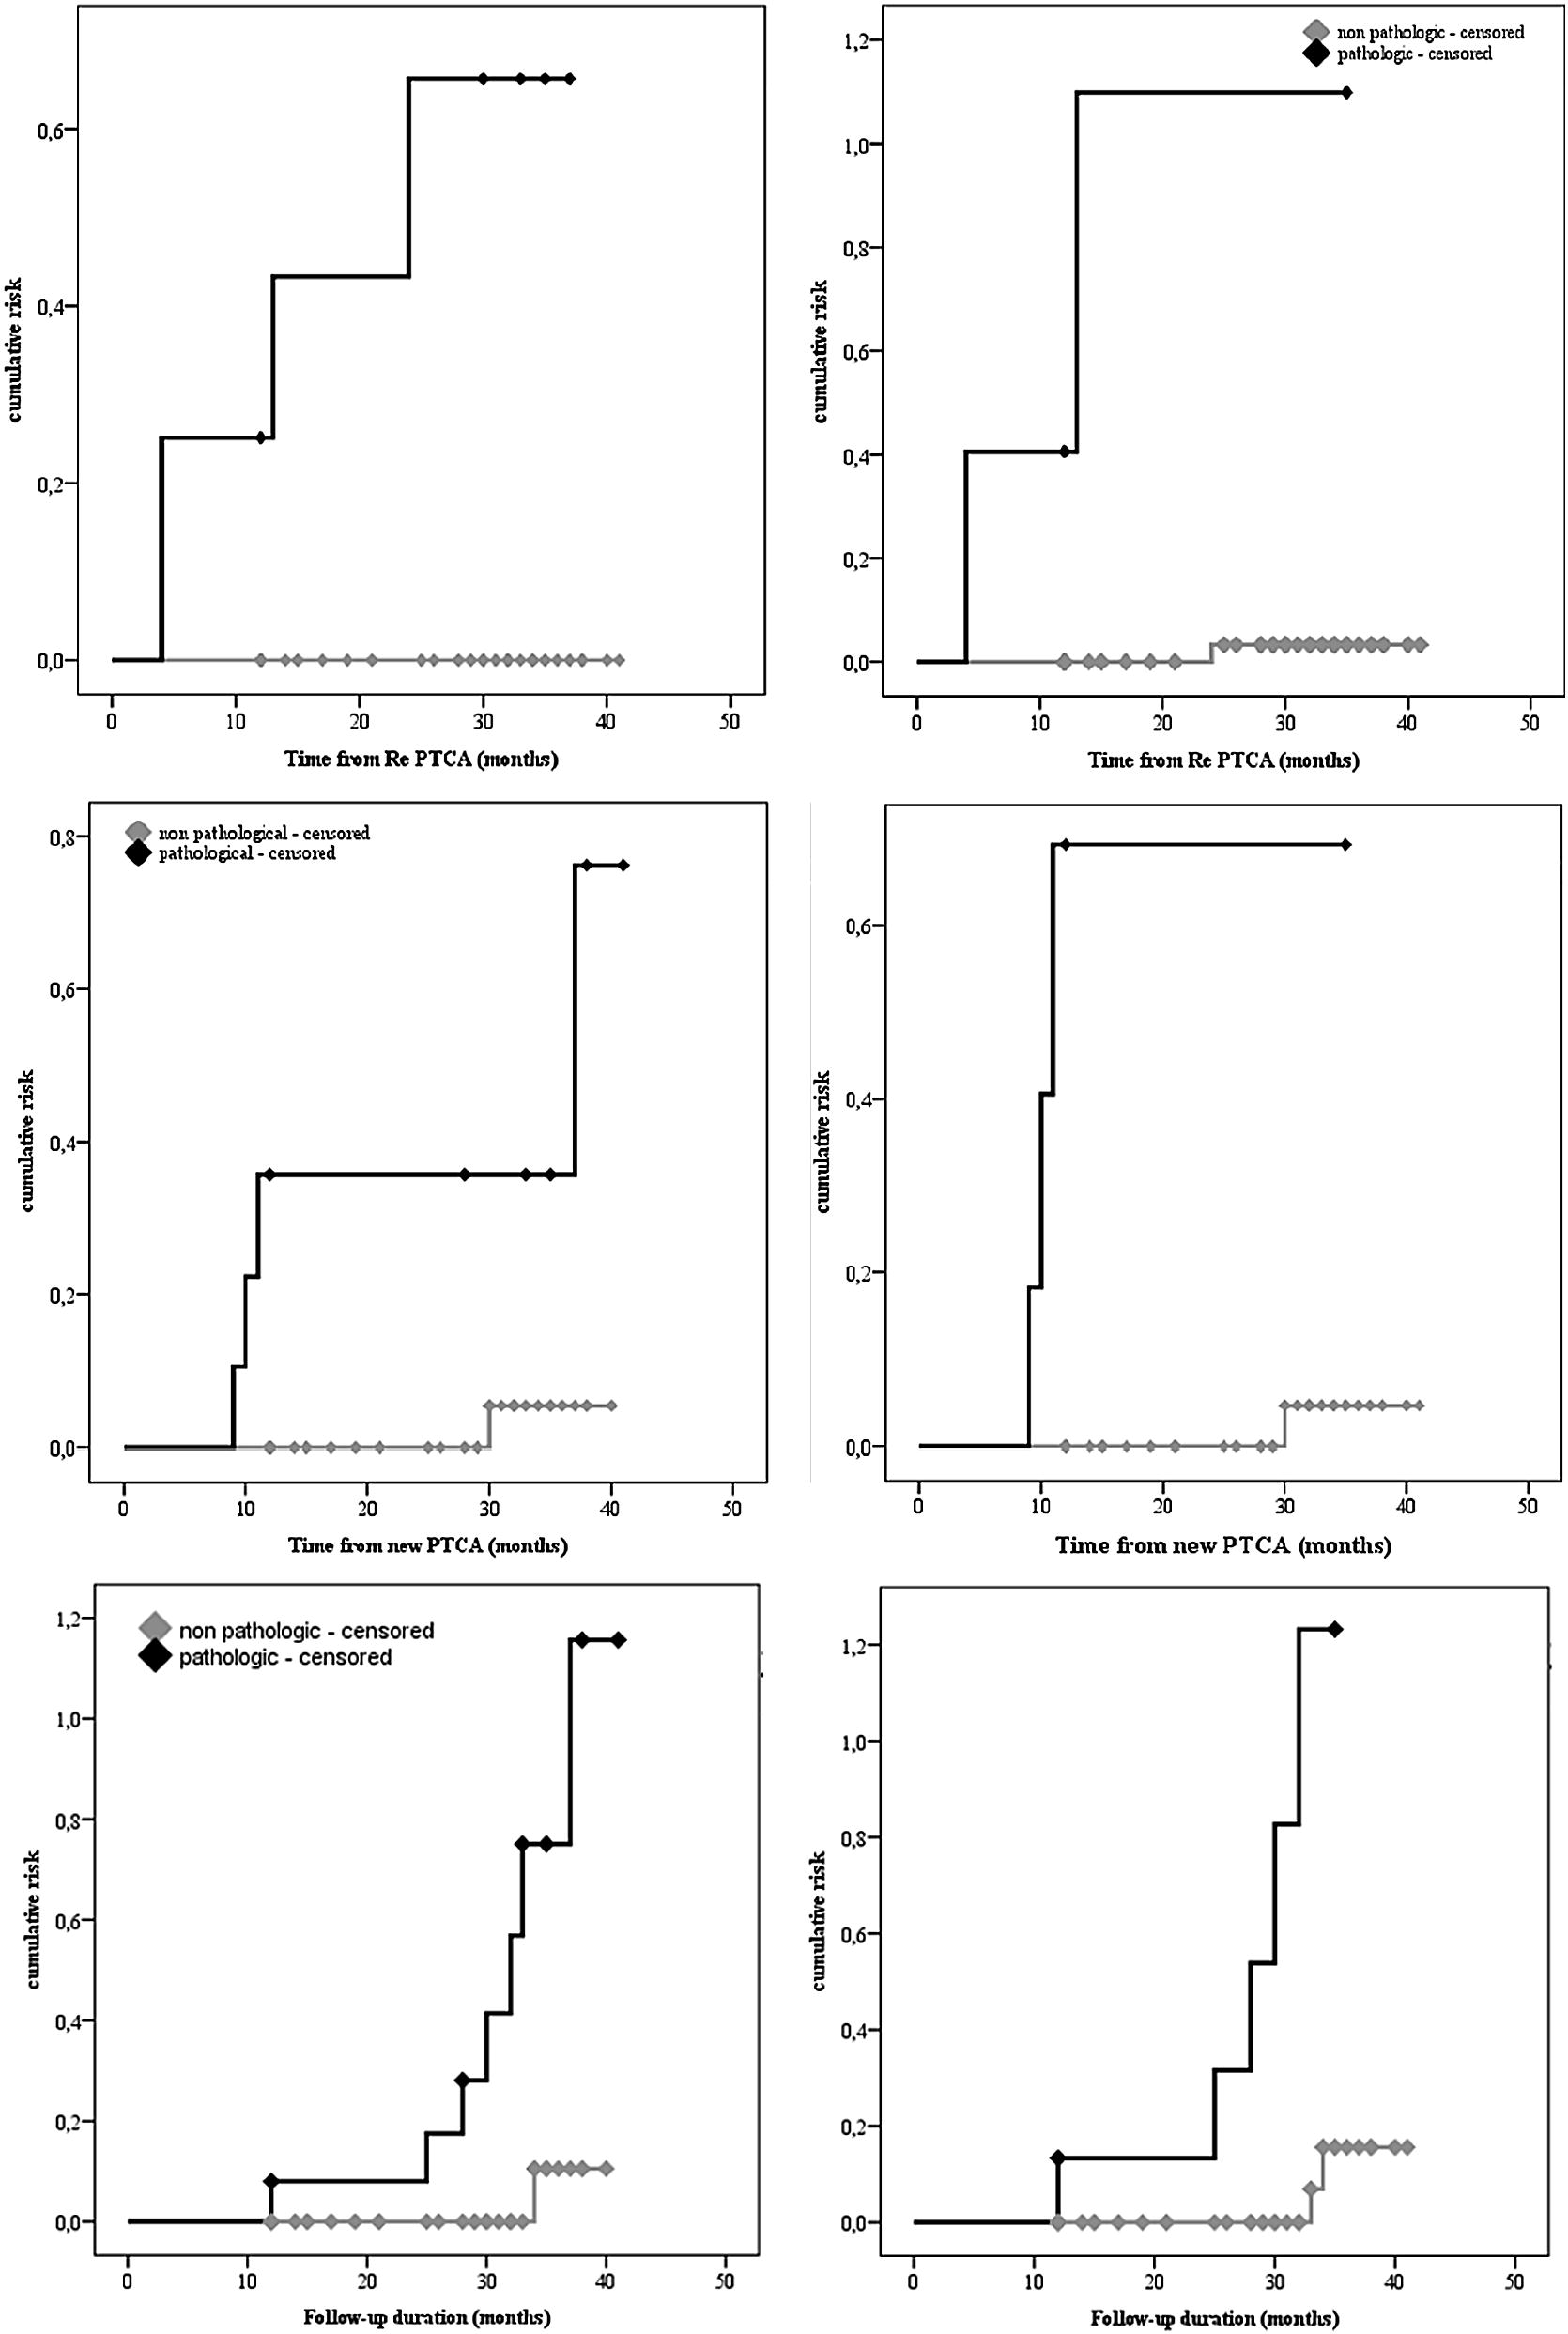
Fig. 2.

(Upper panel) K–M curves describing the risk of re-stenosis according to the values of the analyzed cytokines. Respectively adiponectin (left) and TNF-alpha (right). (Central panel) K–M curves describing the risk of new stenosis according to the values of the analyzed cytokines. Respectively adiponectin (left), resistin (right). (Lower panel) K–M curves describing the risk of any coronary event according to the values of the analyzed cytokines. Respectively adiponectin (left), resistin (right)
