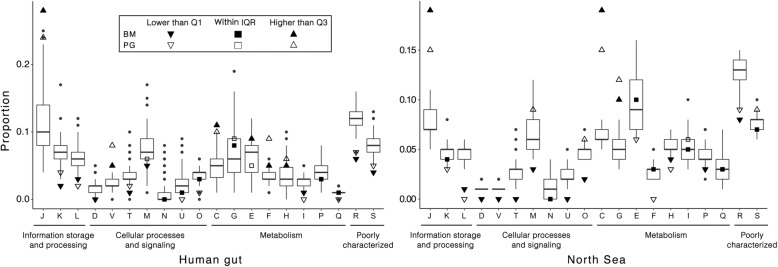
Fig. 11.
Relative proportion of COG functional categories for the input genome bins and predicted HGTs from human gut bins. The boxes in the plot are bound by the 25% to 75% quartile proportions with the thick line being the median value. Q1, Q3 and IQR refer to the 25%, 75% and interquartile range, respectively. The upper whisker refers to the largest observation less than or equal to upper Q3 + 1.5 × IQR, while the lower whisker refers to the smallest observation greater than or equal to Q1 − 1.5 × IQR. COG categories indicated by letters on the x-axis are the same as in Fig. 9

