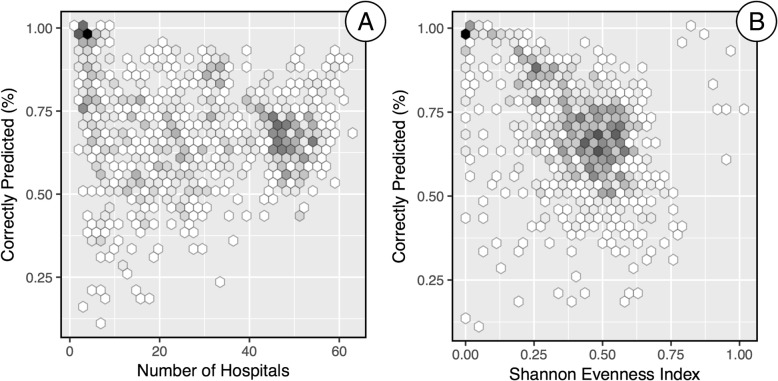
Fig. 6.
Percent of hospital visits correctly predicted for each Zip Code. Predictions were made using the M2SFCA-DLL-HOSP combination plotted against (a) the number of hospitals within 90 min of each Zip Code and (b) the Shannon’s Evenness Index values. The number of points in each hexagon ranges from 1 (white) to 18 (black)

