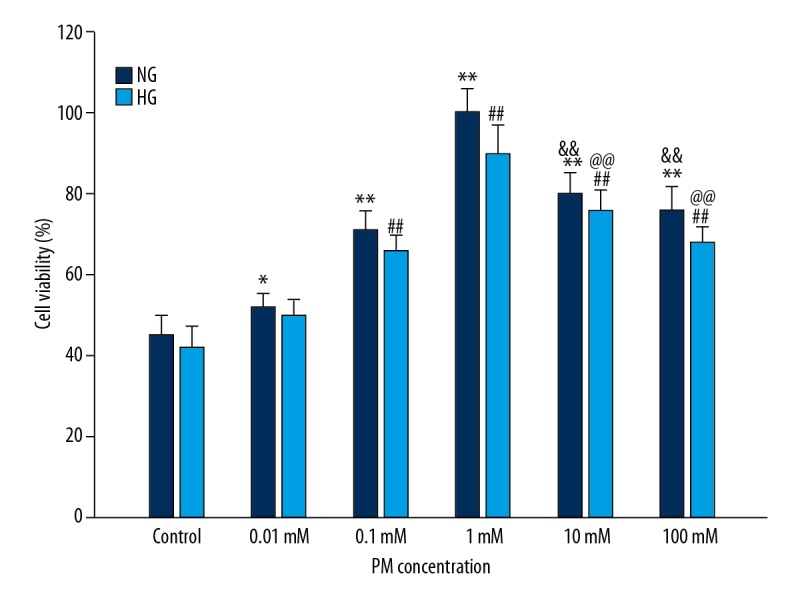
Figure 1.

PM affected increases of HK-2 cells viability. Values are presented as means ± standard deviation. NG – normal glucose, 5.5 mM glucose; HG – high glucose, 30 mM glucose. (* P<0.05, ** P<0.01 compared with NG of control group. # P<0.05, ## P<0.01 compared with HG of control group. & P<0.05, && P<0.01 compared with NG of PM at 1 mM. @ P<0.05, @@ P<0.01 compared with HG of PM at 1 mM). PM – pyridoxamine; HK-2 – human proximal tubular epithelial cells.
