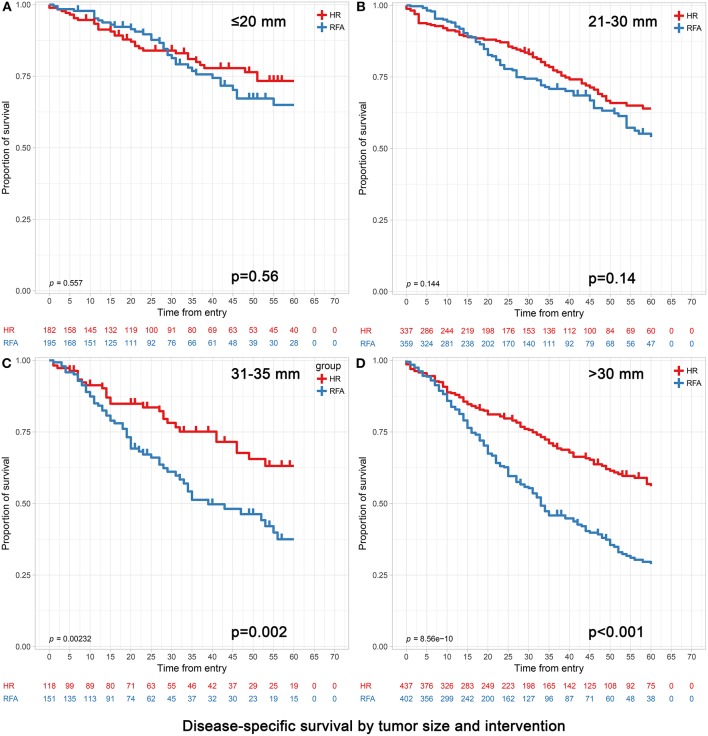
Figure 2.
Disease-specific survival analyses based on tumor size groups and interventions within each group (age >65). (A) 0–20 mm group; (B) 21–30 mm group; (C) 31–35 mm group and (D) 31–50 mm group. (C) The extra 31–35 mm group was to investigate which treatment was more appropriate when the tumor size was slightly larger than 30 mm. (D) The 31–50 mm group also included the patients with the 31–35 mm tumors in (C).

