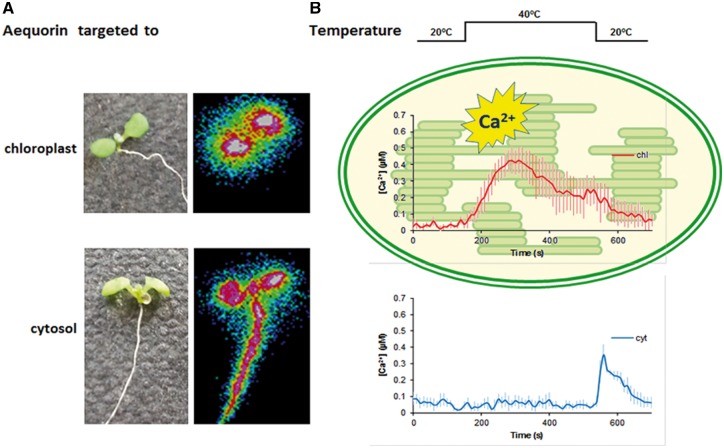
Fig. 1.
Detection of calcium signals in chloroplasts and in the cytosol upon temperature changes. (A) Representative image of seedlings (brightfield, left) expressing aequorin either in the chloroplast (upper panel), or in the cytosol (lower panel), and their total aequorin signal output (right panels) for the time measured (including discharge), showing that the signal only appears in plant shoots of the chloroplast-targeted line, and in the entire seedling for lines harboring the cytosolic aequorin. The colors represent the aequorin signal intensity (calcium signal) in pseudocolors using a scale ranging from cold (low signal) to warm colors (strong signal). (B) Quantification of the calcium signal in response to temperature shifts in the chloroplast and the cytosol corresponding to seedlings shown in (A).

