Figure 3.
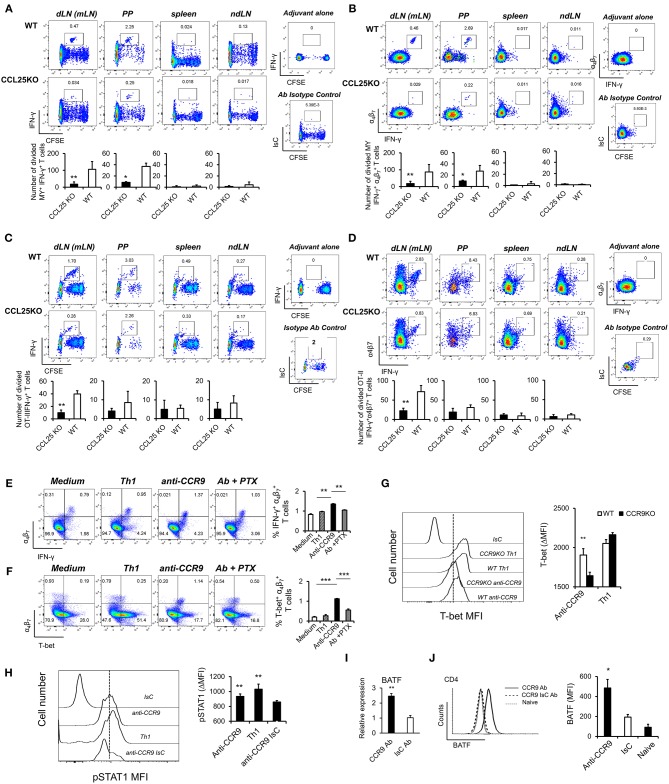
CCR9 signals induce Th1-like cells. MY (A,B) or OT-II (C,D) naïve T cells (107/mouse) were labeled with CFSE (4 μM) and injected intravenously into WT and ccl25−/− syngeneic female recipients. Recipient mice received cognate peptide (100 μg Dby or 0.5 μg OVA-DEC peptide) plus ODN adjuvant (50 μg) orally 24 h later. Five days later, T cells were separately harvested from mesenteric LN (draining LN, dLN), inguinal and axillary (non-draining LNs, ndLN) and the spleen. Production of IFN-γ by divided MY (A) and OT-II (C) T cells was assessed by intracellular staining and flow cytometry. T cells were identified by gating on the CD4+ Vβ6+ (MY) or Vα2+ (OTII) populations. Panels (C) and (D) show the production of IFN-γ by divided MY an OTII T cells, respectively. The mean number of T cells from three independent experiments of identical design is shown below each set of representative dot plots (±SD, n = 3, N = 2). (E,F) Naive T cells were activated either with plastic bound anti-CD3 in culture medium, or under Th1-skewing culture conditions or in the presence of an activating CCR9 antibody (7 μg/ml). In some experiments, T cells were activated in the presence of the anti-CCR9 antibody in the presence of pertussis toxin (PTX, 0.1 μg/ml). Representative dot-plots of IFN- and T- T cells (gated on CD3+CD4+ populations) 5 days after activation and the mean number of T cells from three independent experiments of similar design is shown in panels (E,F), respectively (±SD). Of note, Th1-skewing culture led to T-bet expression mainly in T cells (F). (G) WT and ccr9−/− naive T cells were activated either with plastic bound anti-CD3 under Th1-skewing culture conditions or in the presence of an activating CCR9 antibody (7 μg/ml). Five days later, expression of T-bet was assessed by flow cytometry. A representative histogram and the mean T-bet MFI from three independent experiments of similar design are shown (±SD). (H) Naive T cells were activated either with plastic bound anti-CD3 and antiCD28 under Th1-skewing culture conditions or in the presence of an activating CCR9 antibody (7 μg/ml) or isotype-matched antibody control. Three days later, expression of phosphorylated (p)STAT1 (Ser727) was assessed by flow cytometry. Representative histogram and the mean pSTAT1 MFI from three independent experiments of similar design are shown (±SD). (I,J) Naïve WT T cells were stimulated with plate-bound anti-CD3 and CD28 antibodies in the presence of either 7 μg/mL anti-CCR9 or isotype control antibody cross-linked with 2.5 μg/mL Donkey–anti-goat IgG overnight. T cells were harvested and expression of BAFT mRNA (I) protein (J) by CD4+ T cells was assessed by real-time PCR and intracellular staining, respectively. Staining with an isotype-matched control antibody and proliferation and differentiation in draining lymph nodes of mice injected with adjuvant alone are shown on the right-hand side of each set of dot plots. Bar graph show the mean values obtained in three experiments of identical design each performed in triplicates (±SD). *p < 0.05, **p < 0.01, ***p < 0.001, ****p < 0.0001.

