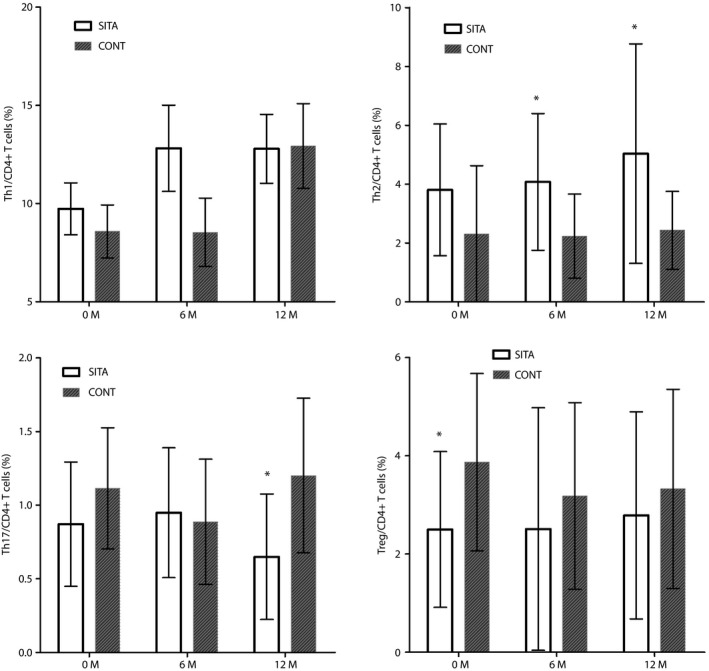
Figure 2.

Percentage of T‐cell subsets between the sitagliptin and insulin treatment (SITA) group and insulin alone treatment (CONT) group at baseline, 6 and 12 months. *P < 0.05, compared with the CONT group. Th1, T helper 1 cells; Th2, T helper 2 cells; Th17, T helper 17 cells; Treg, regulatory T cells.
