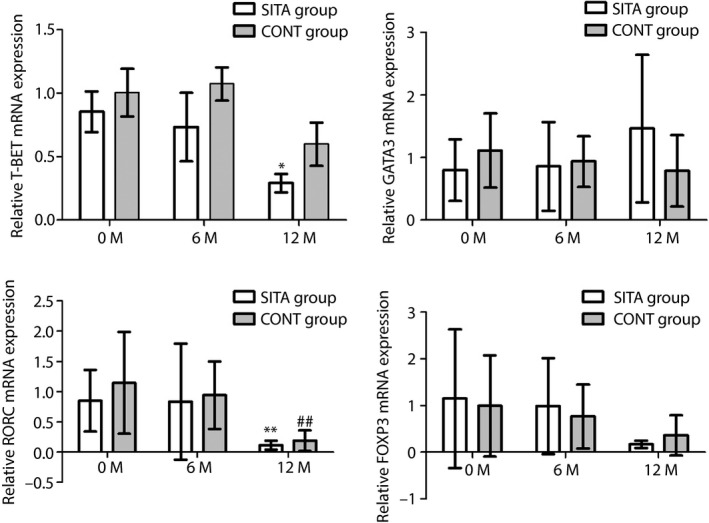
Figure 3.

Expression of T‐cell transcription factors at baseline, 6 and 12 months between the sitagliptin and insulin treatment (SITA) group and insulin alone treatment (CONT) group. Real‐time polymerase chain reaction was carried out to test the messenger ribonucleic acid (mRNA) expression of transcription factors (T helper 1 cells = T box expressed in T cells [T‐BET], T helper 2 cells = GATA binding protein 3 [GATA3], regulatory T cells = forkhead box protein 3 [FOXP3] and T helper 17 cells = related orphan receptor C [RORC]) in the SITA group and CONT group at baseline, 6 and 12 months. *P < 0.05, compared with baseline in the SITA group; **P < 0.01, compared with baseline in the SITA group; and ## P < 0.01, compared with baseline in the CONT group.
