
Figure 2.
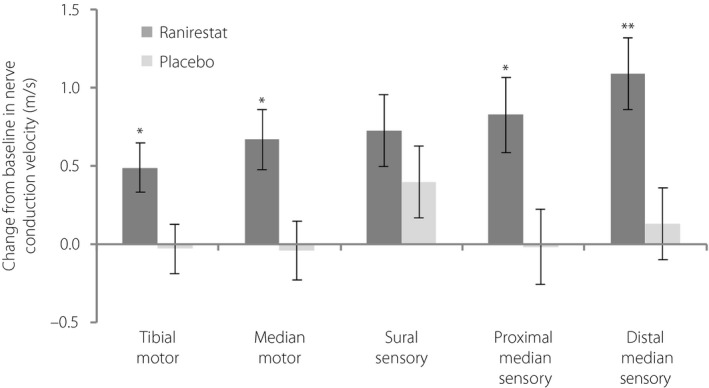
Change from baseline to last observation carried forward (LOCF) for each nerve conduction velocity (m/s; full analysis set). Nerve conduction velocities were increased in all investigated nerves in the ranirestat group. Data shown are least square mean ± standard error change from baseline. P‐values were obtained from an analysis of covariance model with change from baseline to LOCF and the baseline value as a covariate. *P < 0.05; **P < 0.01.