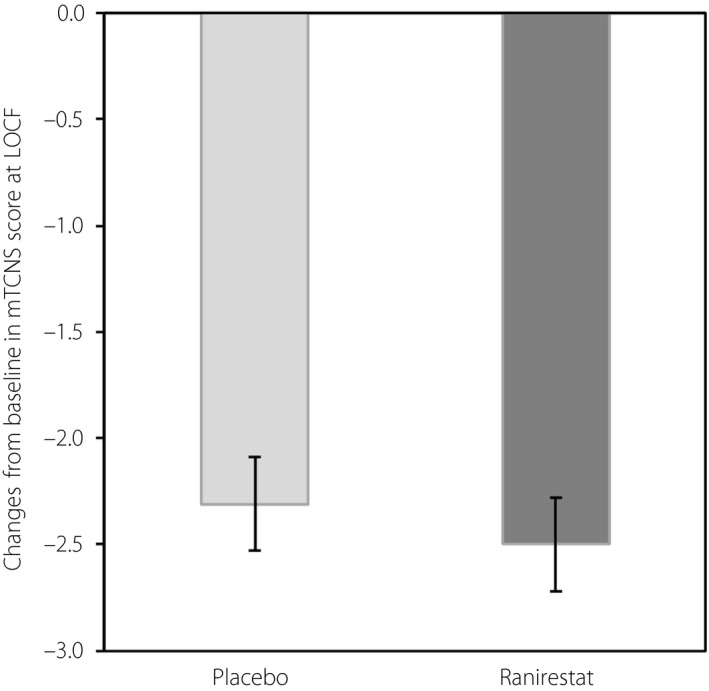
Figure 3.

Change from baseline to (LOCF) in total modified Toronto Clinical Neuropathy Score (mTCNS; full analysis set). Ranirestat n = 268; placebo n = 269. There was no significant difference between the groups. Data shown are least square mean ± standard error change from baseline. P‐values were obtained from an analysis of covariance model with change from baseline to LOCF and the baseline value as a covariate.
