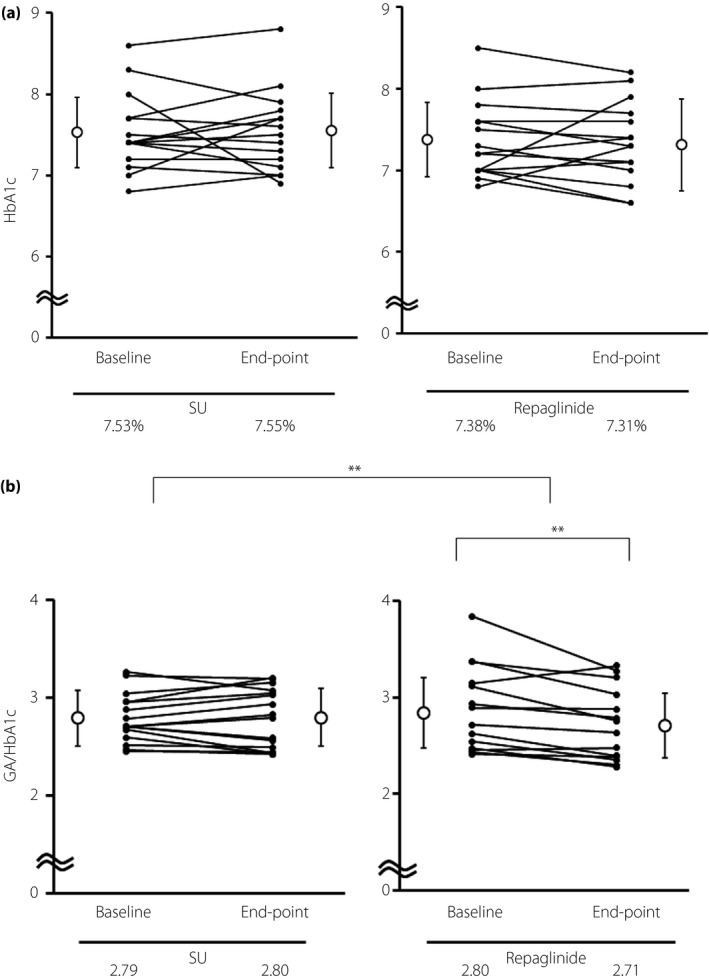
Figure 2.

(a) Comparison of changes in glycated hemoglobin (HbA1c) before and after treatment in each group. (b) Comparison of changes in the glycated albumin (GA) to HbA1c (GA/HbA1c) ratio before and after treatment in each group. Values are means, and P‐values were generated using paired or unpaired Student's t‐tests, with **P < 0.01 representing statistical significance. Repaglinide, the group that switched from sulfonylurea to repaglinide from the start of the trial period; SU, the group that continued sulfonylurea during the trial period.
