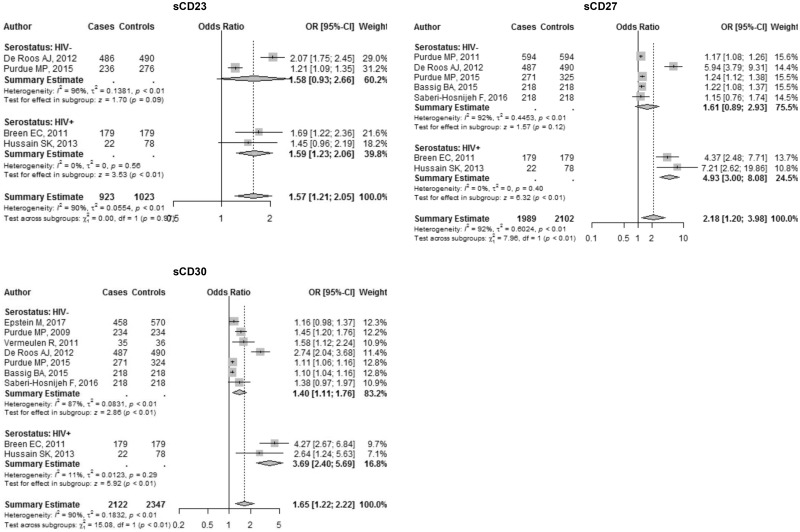
Figure 3.
Forest plots for soluble receptors. Odds ratio (OR) point estimates represented by gray squares with error bars indicating 95% confidence intervals (CIs); the size of the squares is proportional to the precision weight of each study in the random-effects meta-analysis. Diamonds indicate the summary ORs calculated from a random-effects model, with the width denoting the 95% CIs. WoS = Web of Science.

