Figure 2.

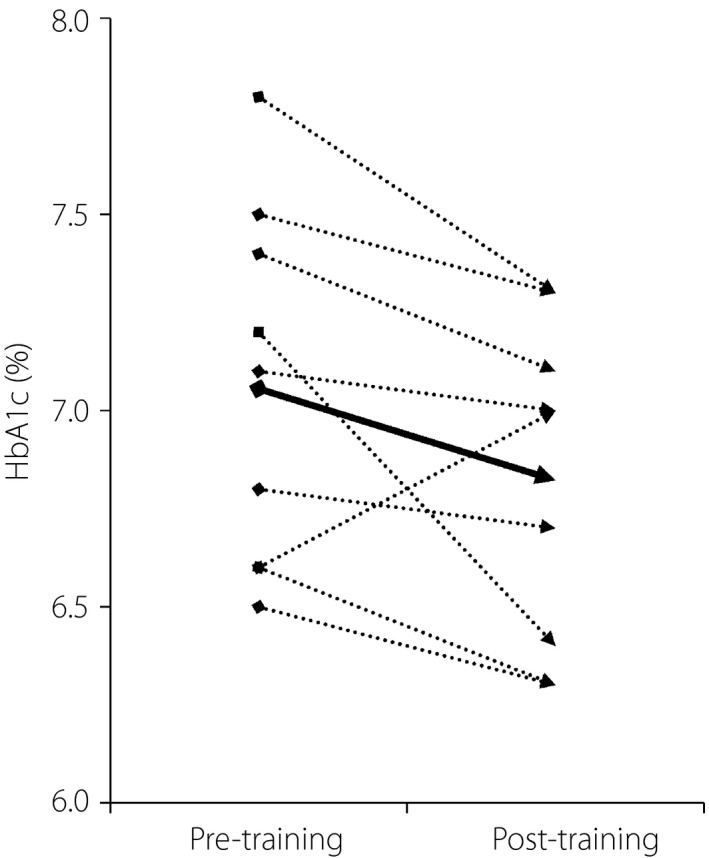
Changes in glycated hemoglobin (HbA1c) in the long‐term study. Dotted lines show the changes for each participant. The solid bold line shows the change in mean value for all (9) participants.

Changes in glycated hemoglobin (HbA1c) in the long‐term study. Dotted lines show the changes for each participant. The solid bold line shows the change in mean value for all (9) participants.