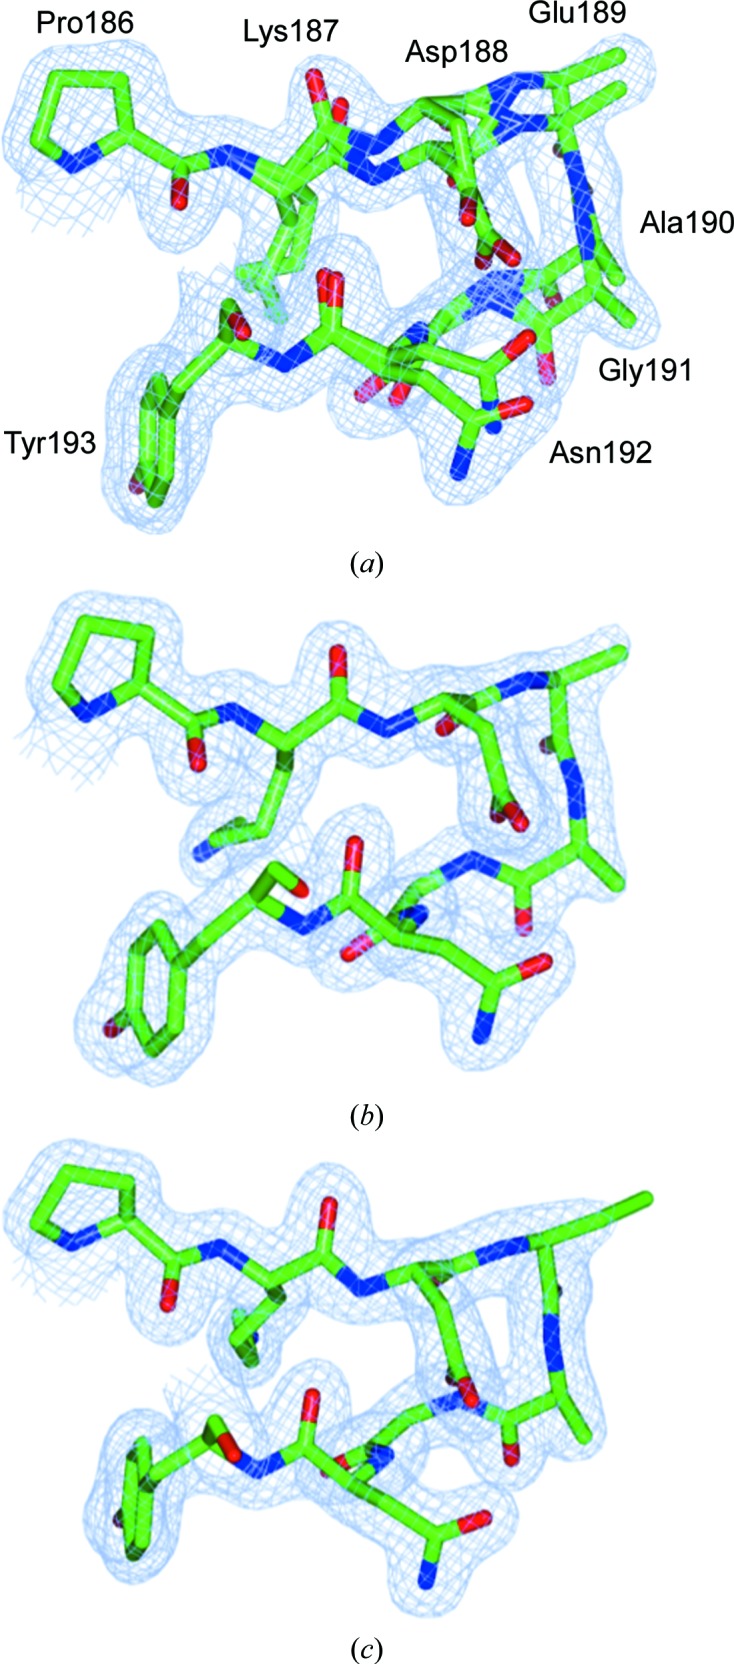
Figure 5.

2F o − F c electron-density maps for the AcNiR data set 1 structures derived from (a) all images, (b) the small unit cell only and (c) the large unit cell only. The maps are contoured at 0.311 e− Å−3 (all data), 0.368 e− Å−3 (AcNiR-small) and 0.348 e− Å−3 (AcNiR-big). Note the dual conformations in (a) with occupancies (0.3 and 0.7) consistent with the proportion of large-cell and small-cell images within data set 1. This figure was prepared using CCP4mg (McNicholas et al., 2011 ▸).
