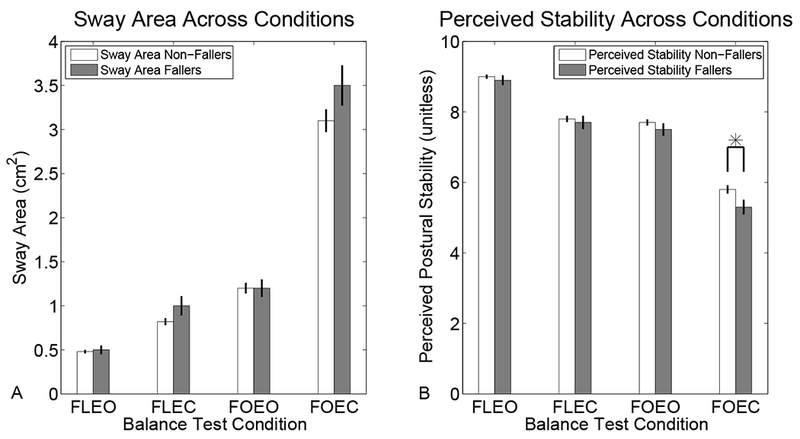
Figure 3.

Change in (A) sway area and (B) perceived postural stability across the rank ordered balance test conditions. Lighter bars represent non-fallers and darker bars represent fallers. Error bars represent standard error of the mean. * denotes significant between group difference, note that this group difference was only present for perceived stability and only in the FOEC condition.
