
Figure 2.
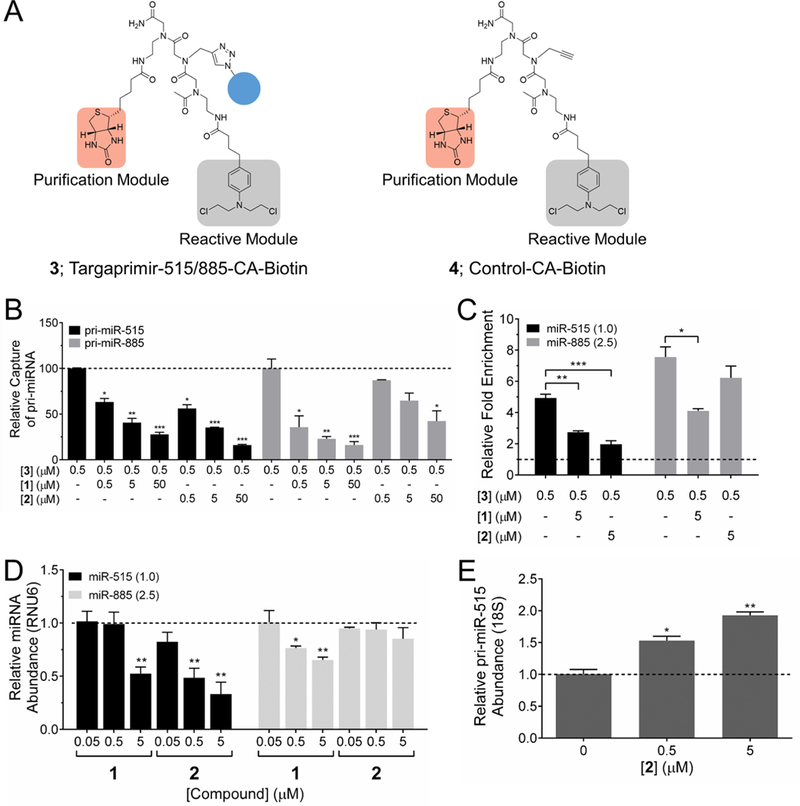
Studying target engagement via Chem-CLIP and C-Chem-CLIP and the effects of compounds on miRNA biogenesis in MCF-7 cells. (A) Structures of Targaprimir-515/885-CA-Biotin (3), which is comprised of the RNA-binding module 1, a biotin purification module and a cross-linking chlorambucil (CA) module, and control compound Control CA-Biotin (4), which lacks the RNA-binding module. (B) C-Chem-CLIP of pri-miR-515 and pri-miR-885 by using increasing concentrations of 1 or 2 to compete with 3 (0.5 μM) after 16 h of incubation. Data represent mean ± s.e.m. (n ≥ 3). *p < 0.05, **p < 0.01, ***p < 0.001 compared to Chem-CLIP pull-down samples without competitor, as determined by a two-tailed Student t test. (C) Treatment of cells with 3 affords enrichment of miR-515 and miR-885 in the pulled down fraction. Addition of 1 competes off reaction of 3 with miR-515 and miR-885, while 2 only competes off reaction of 3 with miR-515. Both results indicate on-target effects in cells after 24 h of treatment. Above the dotted line indicates enriched levels of the measured miRNA in the pulled down fraction versus the levels of the miRNA before pull-down. Relative expression levels of miRNAs are shown in parentheses. *p < 0.05, **p < 0.01, ***p < 0.001 compared to Chem-CLIP samples, as determined by a two-tailed Student t test. (D) RT-qPCR analysis of miR-515 and miR-885 production upon compound treatment after 48 h. 1 reduces the levels of mature miR-515 and miR-885 similarly, while 2 only reduces levels of miR-515. Dotted line represents levels of miRNA in untreated samples. Data represent mean ± s.e.m. (n ≥ 3). *p < 0.05, **p < 0.01, compared to untreated samples, as determined by a two-tailed Student t test. (E) RT-qPCR analysis of the effect of 2 on pri-miR-515 levels after 48 h. Data represent mean ± s.e.m. (n ≥ 3). *p < 0.05, **p < 0.01 compared to untreated samples, as determined by a two-tailed Student t test.