
Figure 3.
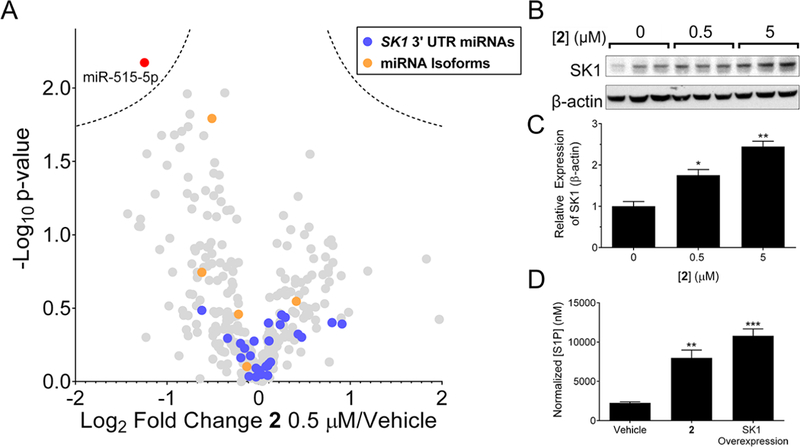
Evaluation of downstream effects upon miR-515 knockdown by 2. (A) Volcano plot representing fold change and p-values of samples treated with 0.5 μM of 2 compared to untreated samples after 48 h of treatment. Data represent mean; dotted lines represent a false discovery rate of 1% and an S0 of 0.1, indicating an adjusted p-value of 0.01; p-values were determined by a two-tailed Student t test when compared to untreated samples. Red point, effect on miR-515; blue points, miRNAs predicted by TargetScan to bind to the SK1 3′ UTR; orange points, RNA isoforms to miR-515 hairpin precursor; and, gray points, all other expressed miRNAs in MCF-7 cells. (B) Representative Western blot image of SK1 protein as a function of compound concentration after 48 h of treatment. (C) Quantification of SK1 protein expression relative to loading control β-actin. (D) Effect of 2 (0.5 μM) or SK1 overexpression on S1P second messenger levels as measured by ELISA after 48 h of treatment. Data represent mean ± s.e.m. (n ≥ 3). *p < 0.05, **p < 0.01 compared to untreated samples, as determined by a two-tailed Student t test.