Figure 5.

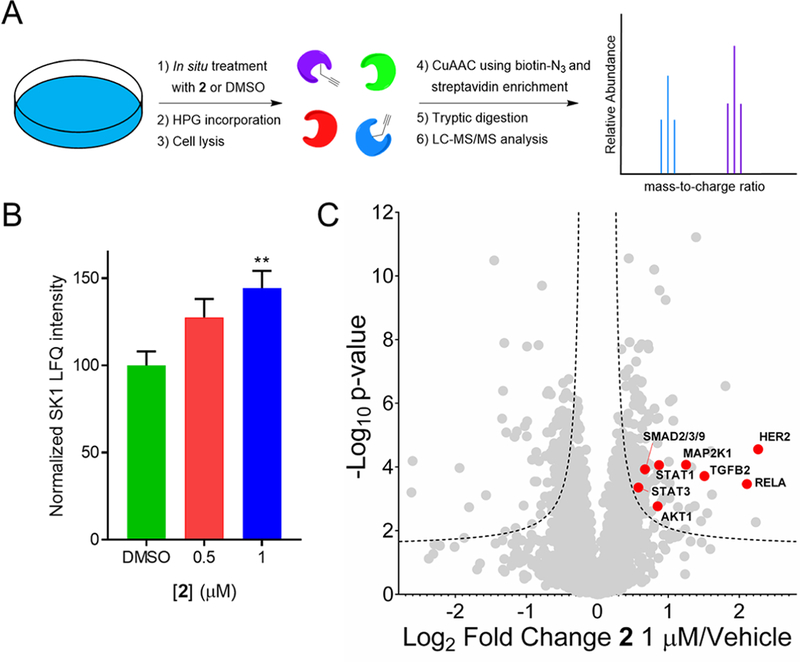
Effect of Targaprimir-515 (2) on protein expression in MCF-7 cells evaluated by global proteomics. (A) General scheme showing profiling of newly synthesized proteins using incorporation of homopropargylglycine (HPG) into the proteome. (B) Label-free quantification (LFQ) intensity of SK1 upon treatment with 0.5 or 1 μM 2 for 48 h. Data represent mean ± s.e.m (n = 6). **p < 0.01 compared to DMSO samples, as determined by a two-tailed Student t test. (C) Changes in protein expression caused by treatment with 1 μM 2 for 48 h. LC-MS/MS and MaxQuant analysis showed an upregulation of 4% of proteins (180/4378). Dotted lines represent a false discovery rate of 1% and an S0 of 0.1, indicating an adjusted p-value of 0.01. HER2 is the most upregulated protein (∼4-fold) with 2 treatment. Pathway analysis of these proteins revealed a role in cellular growth and proliferation, as expected upon SK1 pathway activation.
