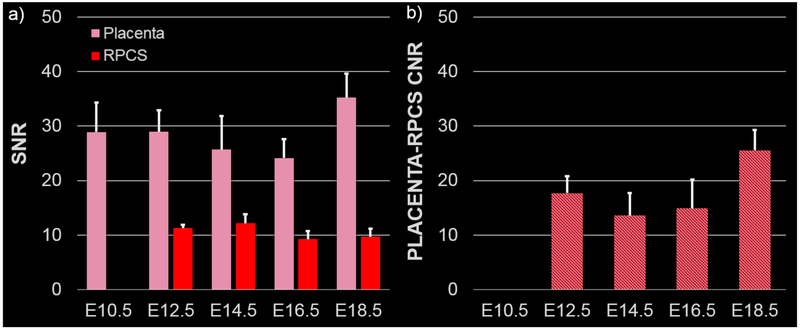
Figure 3:
Placenta and retroplacental clear space (RPCS) are well visualized on contrast-enhanced T1-weighted MRI. a) Signal-to-noise ratio (SNR) is calculated for the placenta (pink) and RPCS (red) at each of the five gestational time points. b) Contrast-to-noise ratio (CNR) between the placenta and RPCS is calculated at each of the five gestational time points. Error bars indicate standard deviation among fetal placental units at each time point.

