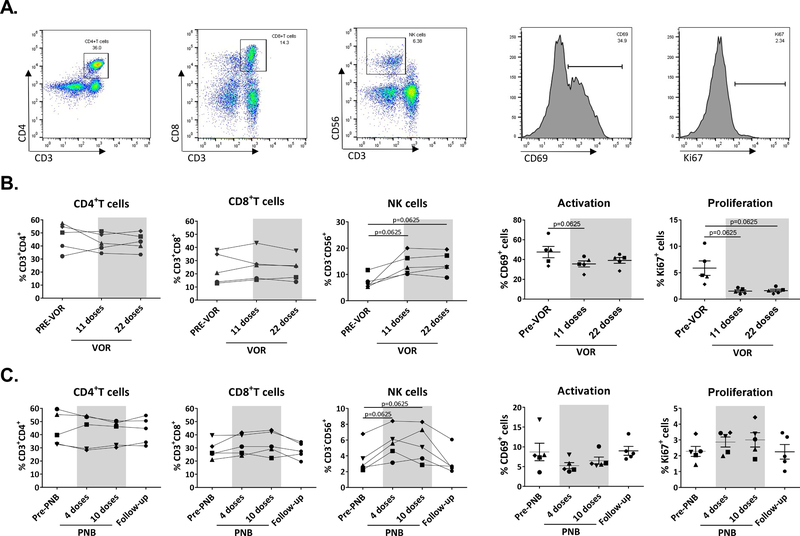
Fig. 1. Frequency of cell populations, proliferation and activation during HDAC inhibitor treatment.
PBMC were stained with a panel of monoclonal antibodies to analyze cell populations and expression of proliferation and activation markers. A. Representative plot of cell gating strategy. B. VOR treatment: The proportion of CD4 and CD8+T cells did not change during VOR treatment, but frequency of NK cells increased after 11 doses of VOR, with increases maintained after 22 doses. Expression of the proliferation marker Ki67 and the activation marker CD69 decreased during VOR treatment. C. PNB treatment: CD4 and CD8+T cells remained stable during PNB treatment, but NK cells showed an increase, that was lost after the end of treatment. A decrease in CD69 was observed during PNB treatment. Each symbol represents cells from a different study participant. Wilcoxon matched-pairs signed rank test.

