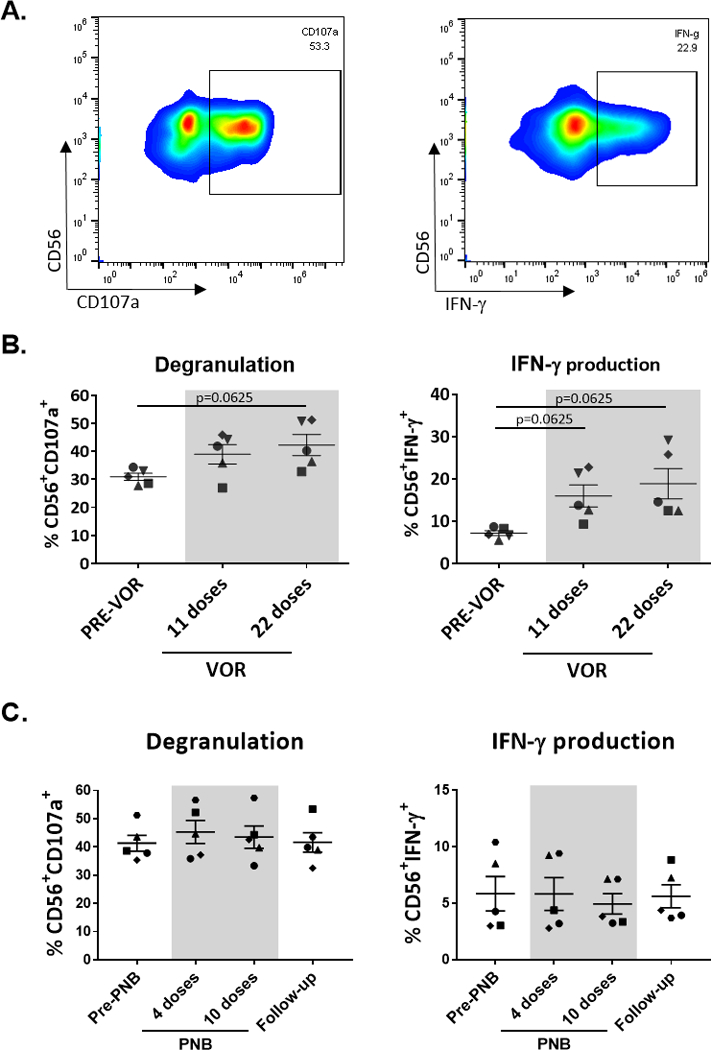
Fig. 2. NK cell cytotoxicity and cytokine production.

NK cells were negatively isolated from thawed PBMCs and cultured with the cell line K562 to measure degranulation through the marker CD107a and IFN-γ production by intracellular staining. A. Representative plots of cells from one participant. B. VOR treatment: An increase in both degranulation and IFN-γ production was observed after VOR exposure. C. PNB treatment: Cytotoxic and IFN-γ potential remained stable during PNB treatment. Each symbol represents cells from a different study participant. Wilcoxon matched-pairs signed rank test.
