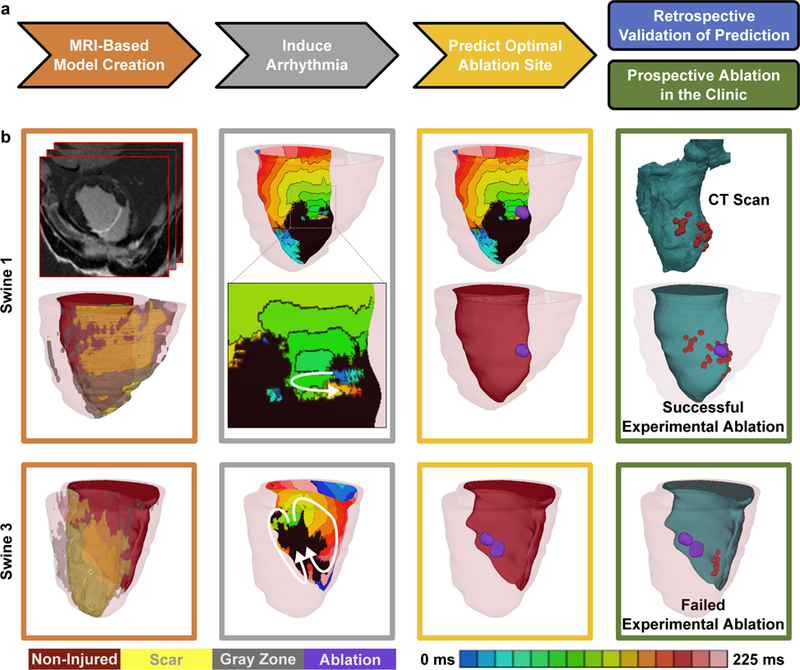
Figure 1: Virtual-heart ablation-target (VAAT) prediction: protocol and results from the animal study.

(a) Flow-chart summarizing the protocol (arrowed steps) and retrospective and prospective studies. (b) In silico models and predictions for one case of successful mapping-guided ablation in Swine 1 (top), and one case of failed mapping-guided ablation in Swine 3 (bottom). Panels, from left to right: reconstructed ventricular model with different remodeled regions and the upper, top panel showing the LGE-MRI stack for Swine 1; endocardial electrical activation maps of the infarct-related VTs with white arrows showing the direction of propagation of the excitation wave, inset shows the zoomed-in propagation waves through channels in the scar in Swine 1; purple circles correspond to in silico predicted ablation targets on the ventricular endocardial surface; CARTO XP ventricular geometry from post-ablation CT scans co-registered with the MRI-based model for comparison of the predicted ablation targets with experimental mapping-based endocardial ablation locations, where red dots correspond to location of the tip of the catheter during ablation. Panel frame colors correspond to the protocol steps outline in Fig. 1a. Non-injured, scar, gray zone tissues and VAAT ablation targets are shown in red, yellow, gray, and purple respectively. Color scale indicates activation times, from earliest to latest, for images in column 2; black indicates tissue regions that did not activate.
