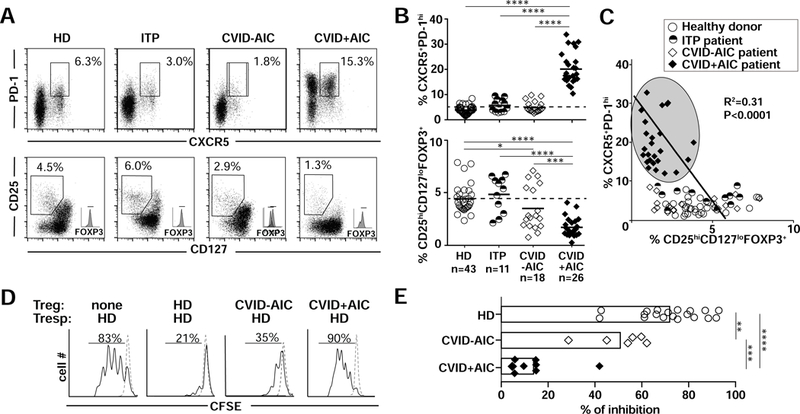
FIG 4. CVID+AIC patients show expanded cTfh and decreased Treg compartments.

(A) Dot plots show (top) CXCR5/PD-1 and (bottom) CD127/CD25 expression on gated CD4+ T cells from representative HD, ITP, CVID-AID and CVID+AIC patients. (B) Summarized frequencies of CD4+CXCR5+PD-1hi cTfh and CD4+CD25hiCD 127loFOXP3+ Treg in HD and patients. Black bars indicate averages. (C) Bivariate analysis of paired cTfh and Treg frequencies reveal that CVID+AIC patients segregate in a specific cTfh-rich and Treg-poor area (gray oval). (D) Representative histograms of heterologous CFSE-labeled HD T responder cell (Tresp) proliferation on day 4 co-cultured or not with CD4+CD25hiCD127lo Tregs from representative subjects. Dashed lines show unstimulated Tresp. (E) Summarized percentages of inhibition by Tregs from 19 HDs, 7 CVID-AICs patients and 7 CVID+AIC patients are represented. Statistically significant differences are indicated: ****P <0.0001, ***P <0.001, **P <0.01 (Mann-Whitney U tests or linear regression analysis).
