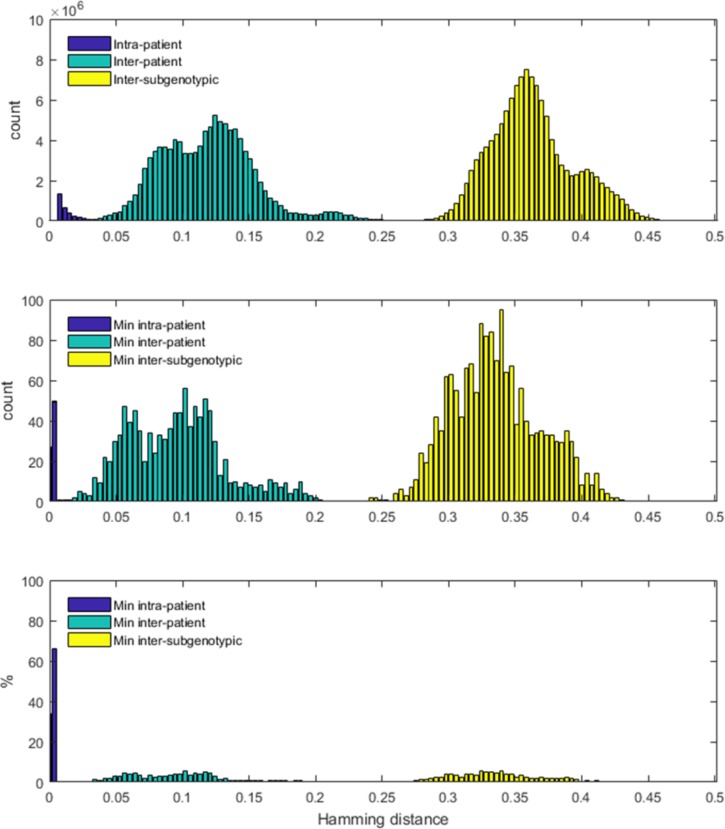
Fig 4. Genetic distances between and within patients and subtypes.
Histograms of pairwise Hamming distances among samples. In all panes, the x-axis displays the distance, and the y-axis displays the count/percentage of pairs found to have that distance. Distances within a patient are denoted by blue; distances between patients from the same subgenotype are denoted by green; distances between patients from different subgenotype are denoted by yellow. (A) All distances between the sequences in the three groups. The y-axis represents the count of the pairs found at a certain Hamming distance. (B) Minimum pairwise distances in the three groups. For each pair of patients in the group, the minimum distance is defined as the minimum distance between the sequences of the two patients. The y-axis represents the count of the pairs with this minimum Hamming distance. (C) Percentage of the minimum distances between patients in the three groups respective to all minimum distances found in the group.

