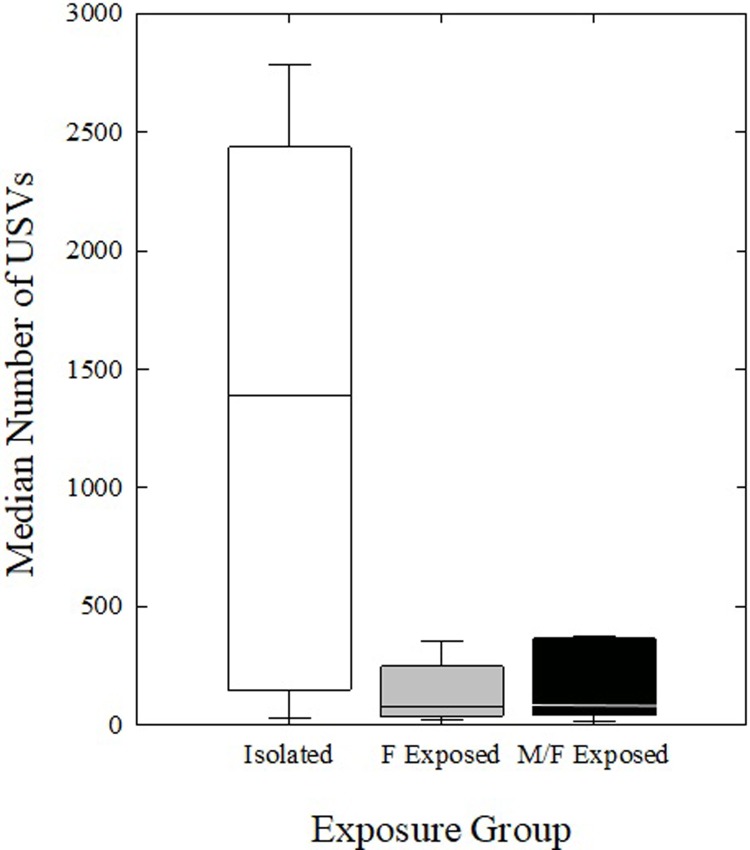
Fig 6. Number of USVs between housing conditions.
Number of USVs produced by Isolated mice (white bars), F Exposed mice (gray bars), and M/F Exposed mice (black bars) in all four recording sessions, averaged across phases 2 and 3. Bars represent upper and lower quartile range of number of USVs, horizontal lines represent the medians.

