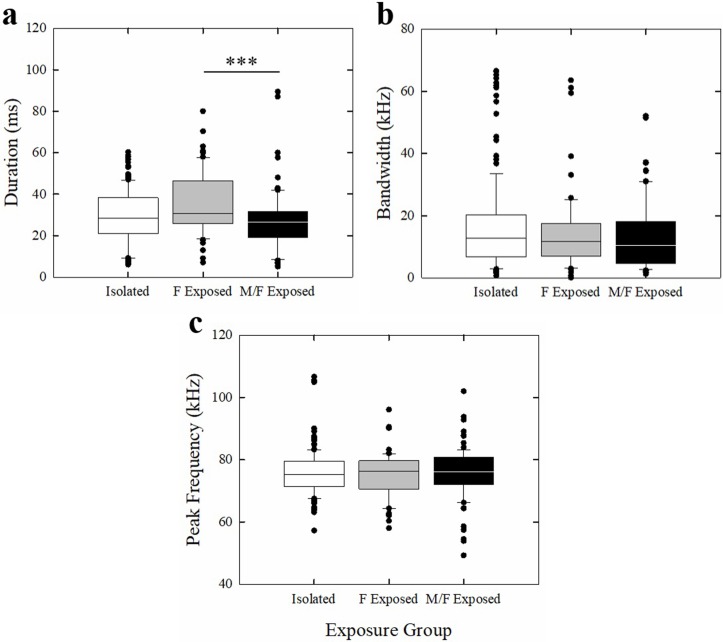
Fig 10. Features of USVs produced by mice in all three housing conditions.
(a) Duration, (b) bandwidth, and (c) peak frequency of USVs from all categories emitted by Isolated (white bars), F Exposed (gray bars), and M/F Expose (black bars) in all recording sessions. Bars represent upper and lower quartile ranges of each feature, horizontal line represents median, circle symbols represent outliers. *** p < 0.001.

