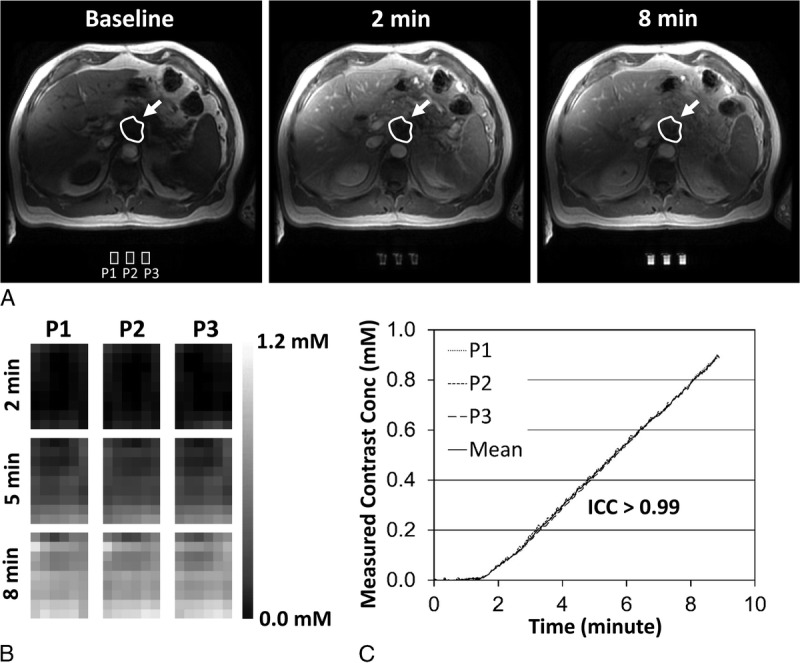
FIGURE 2.

DCE-MRI images with the perfusion phantom. A, Representative DCE-MRI images of a patient having a tumor in the pancreas neck before (baseline) and at 2 and 8 minutes after contrast injection. The tumor and phantom regions are indicated with arrows and white rectangles, respectively. B, Contrast maps of 3 phantom components (P1–P3) at 2, 5, and 8 minutes after contrast injection. C, Contrast enhancement curves (CECs) of the 3 phantom components (P1–P3) and the mean. Intraclass correlation coefficient (ICC) of 3 CECs was higher than 0.99.
