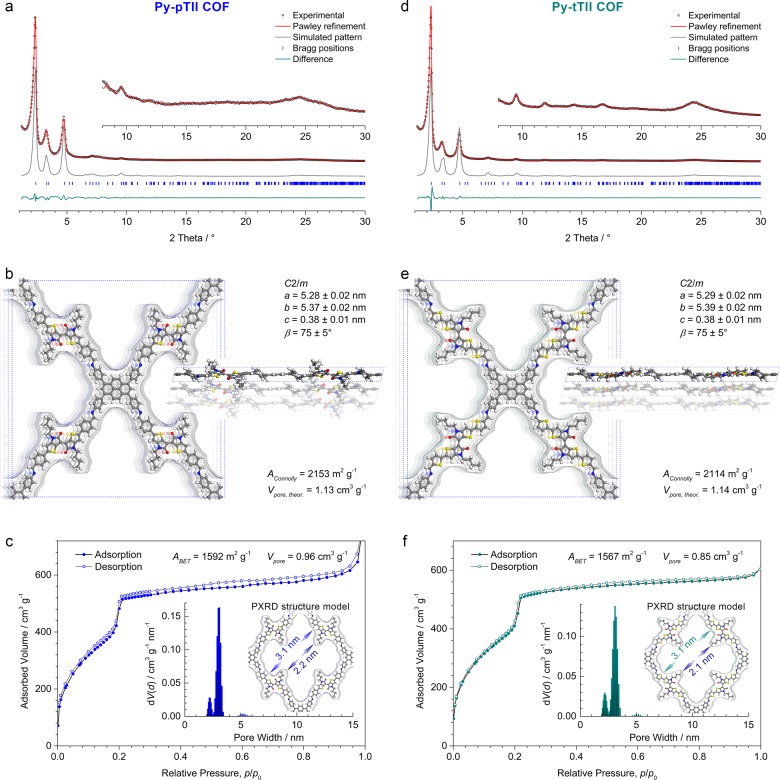
Figure 3.
(a,d) Experimental PXRD patterns (black dots) of the thienoisoindigo-bridged Py-pTII and Py-tTII COFs, respectively. For both COFs, Pawley refinements (red lines) in the space group C2/m provide an excellent fit to the experimental data. Insets, magnified view of the 2θ > 8° region. The simulated PXRD patterns (gray lines) based on the structure models shown in (b) and (e), respectively, agree very well with the experimental and refined patterns of the frameworks. Differences in the peak intensities might stem from slight differences between the simulations and the actual COF structures. (b,e) The Py-pTII and Py-tTII COF unit cells with the viewing direction normal to the a–b plane (left) and along b (right), and the Connolly surfaces calculated for a nitrogen-sized probe molecule. (c,f) Nitrogen sorption isotherms recorded at 77 K. Insets, QSDFT calculations using an equilibrium model yield very narrow pore size distributions with maxima at 3.0 and 3.1 nm, respectively, and an additional porosity at around 2.2 nm due to the alkyl chains of the thienoisoindigo moieties. These values agree very well with the wall-to-wall distances and the reduced pore diameters due to the alkyl chains derived from the refined structure models (blue and green arrows).

