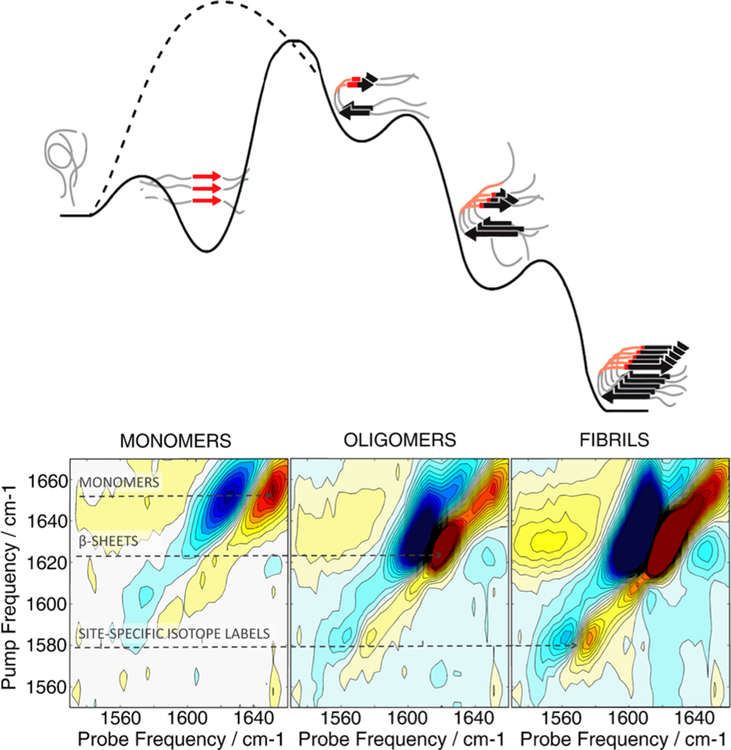
Figure 2.
Top: Schematic free energy diagram of the multistep hIAPP aggregation process. The FGAIL region that participates in the formation of a transient β-sheet intermediate is highlighted in red. Introduction of a proline mutation into the FGAIL sequence inhibits aggregation by destabilizing the intermediate (dashed line). Bottom: 2D IR spectra of isotopically labeled (V17) hIAPP measured at different aggregation times are presented below. Dashed arrows show pump frequencies of 2D IR peaks originating from monomers, β-sheet aggregates, and site-specific isotope labels. Adapted with permission from ref 18.

