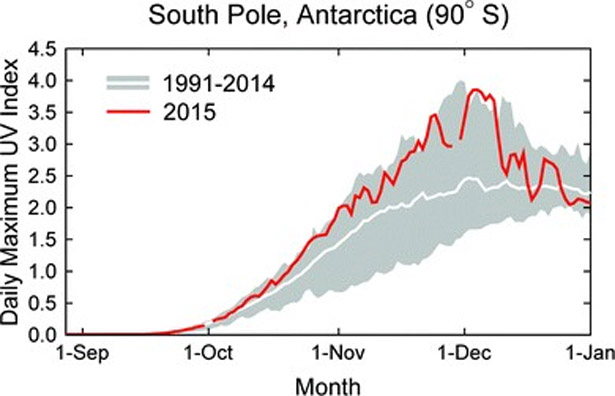
Fig. 1.

Daily maximum UV Index measured at the South Pole in 2015 (red line) compared with the average (white line) and the lowest and highest values (grey shading) of observations performed between 1990 and 2014. Measurements between the second half of October 2015 to mid-December 2015 were close to the upper limit of historical observations. These large values can be attributed to the deep ozone ‘hole’ of 2015, which was well centered over the South Pole. The figure is adapted from r ef. 2 and updated with data from November and December 2015.
