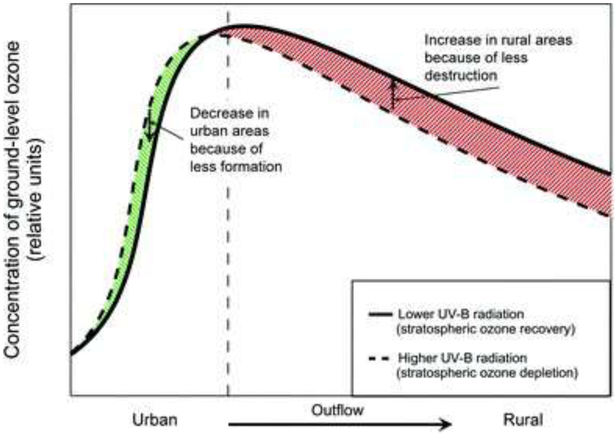
Fig. 12.

Schematic illustration of the evolution of ground-level ozone in urban air and its outflow, as a function of distance from emission sources. Dashed curve gives reference using current UV radiation, while the solid curve is for decreased UV radiation expected upon recovery of stratospheric ozone. The green hatched area shows the resultant de-crease in urban ozone, while the red hatched area shows the increase in regional (background) ozone.
