. 2019 Feb 20;8:e43676. doi: 10.7554/eLife.43676

Figure 1. The SETD3 core region specifically recognizes a fragment of β-actin containing His73.

(A) Domain architecture of full-length human SETD3 (aa 1–594) and the sequence of the β-actin peptide (66–88), with His73 of β-actin highlighted. (B) Representative ITC binding curves for the binding of SETD3 (aa 2–502) to β-actin peptides of different lengths. The molecular ratios, derived Kds and respective standard deviations are also indicated. (C) The overall structure of AdoHcy-bound SETD3 with unmodified β-actin peptide. The SETD3 domains are colored in the same way as in Figure 1A, with the N-SET, SET, iSET and C-SET regions of SETD3 colored in gray, blue, purple and pink, respectively. The peptide is shown in yellow cartoon, while His73 and AdoHcy are shown in yellow and cyan sticks, respectively. His73 of actin and the AdoHcy are labeled.

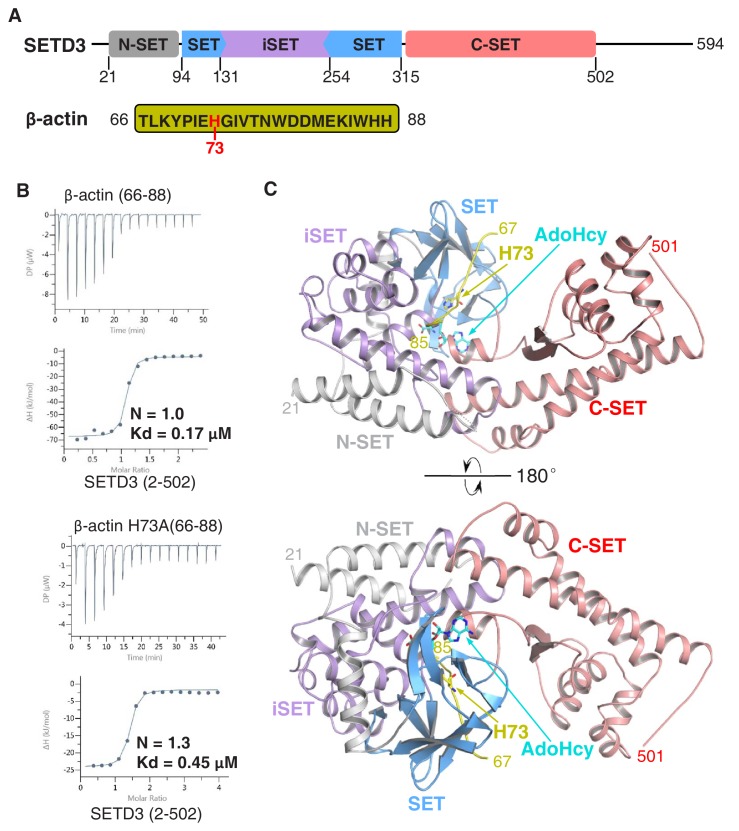
Figure 1.

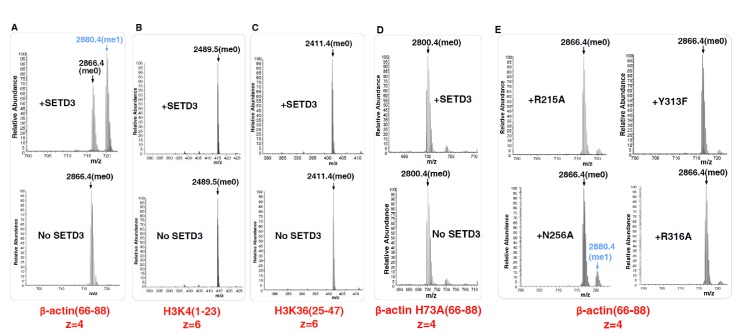
Figure 1—figure supplement 1. Mass Spectrometry data showing the activity of SETD3 toward different peptides.

Figure 1—figure supplement 1.

The core region of SETD3 (aa 2–502) methylates (A) the β-actin peptide (aa 66–88), but not (B) H3K4 (aa 1–23), (C) H3K36 (aa 25–47), or (D) β-actin H73A (aa 66–88). (E) The activity of SETD3 mutants on the β-actin peptide (aa 66–88).
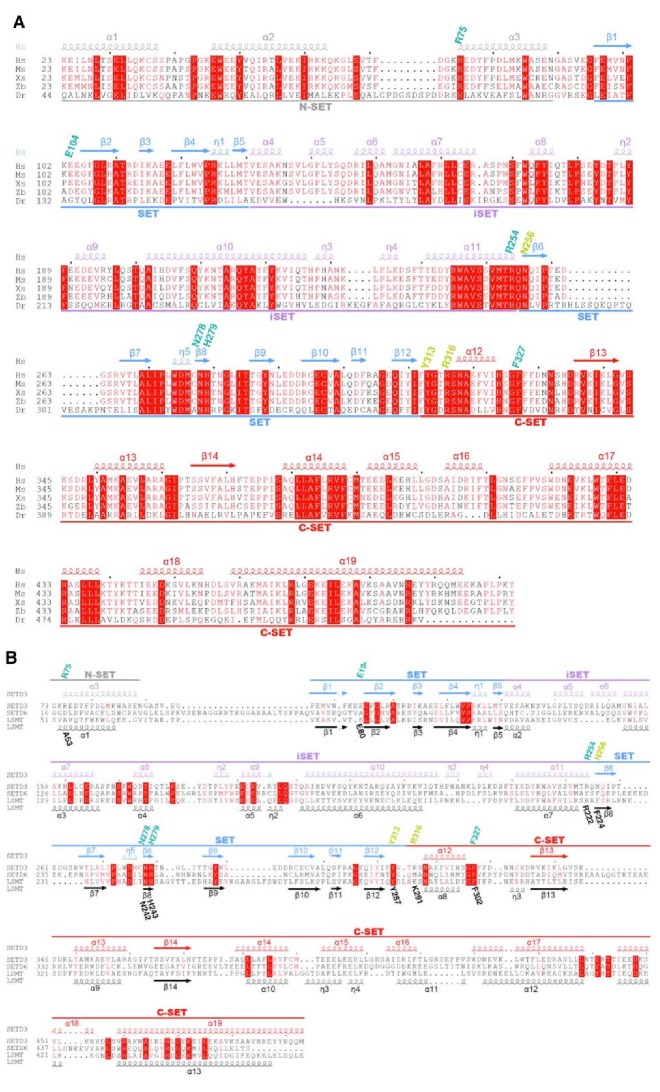
Figure 1—figure supplement 2. Sequence alignment of human SETD3 with its orthologs or other SET domain proteins (SETD6 and LSMT).

Figure 1—figure supplement 2.

(A) Sequence alignment of human SETD3 (Hs, NP_115609.2), mouse SETD3 (Ms, NP_082538.2), Xenopus SETD3 (Xs, NP_001016577), zebrafish SETD3 (Zb, NP_956348.1) and Drosophila SETD3 (Dr, XP_017048262.1). The secondary structures of human SETD3 are colored in the same way as in Figure 1A. The residues involved in binding to AdoHcy and His73 are labeled in cyan and yellow, respectively. (B) Sequence alignment of human SETD3, human SETD6 (NP_001153777.1) and Pisum sativum LSMT (AAA69903.1). The secondary structures, AdoHcy binding residues, and His73 binding residues are labeled as in Figure 1—figure supplement 2A.
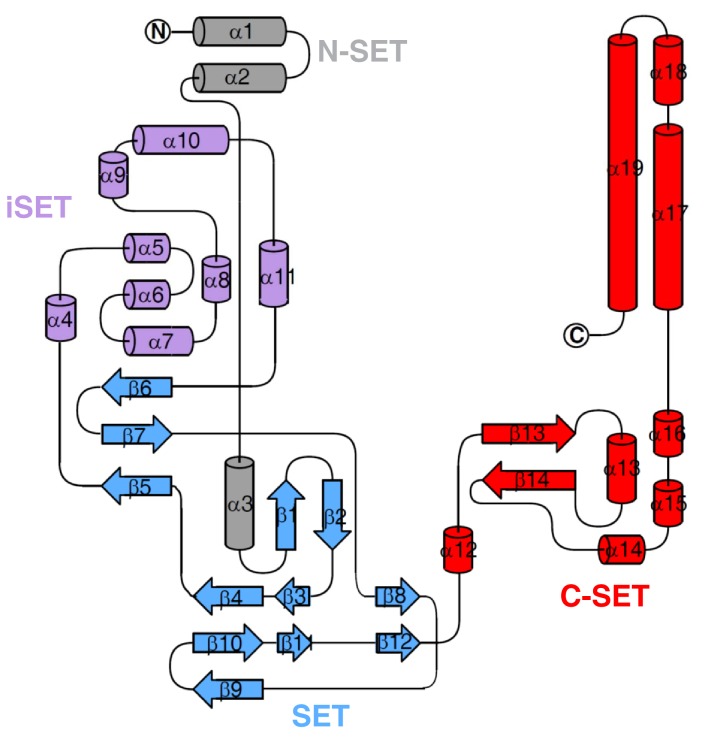
Figure 1—figure supplement 3. Topology of SETD3 (aa 2–502), with secondary structures marked and colored as in Figure 1—figure supplement 2A.

Figure 1—figure supplement 3.

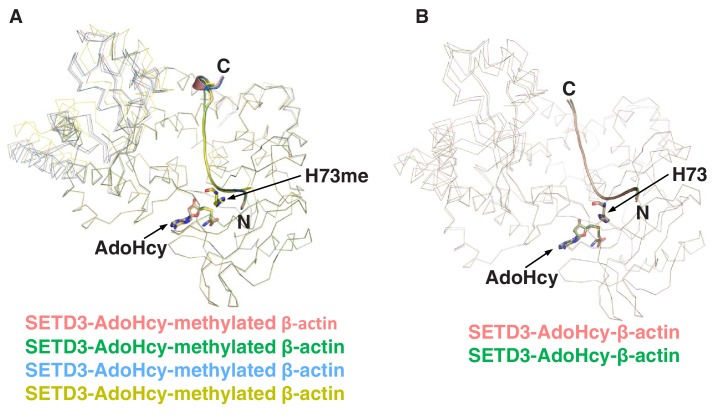
Figure 1—figure supplement 4. Superposition of SETD3 molecules.

Figure 1—figure supplement 4.

(A) Superposition of four SETD3 molecules bound to methylated β-actin in the same asymmetric unit, with the four molecules shown in red, green, blue and yellow ribbons. His73me of β-actin and AdoHcy are shown in sticks. (B) Superposition of two molecules of SETD3 bound to unmodified β-actin in the same asymmetric unit, with the two molecules shown in red and green ribbons. His73 of β-actin and AdoHcy are shown in sticks.
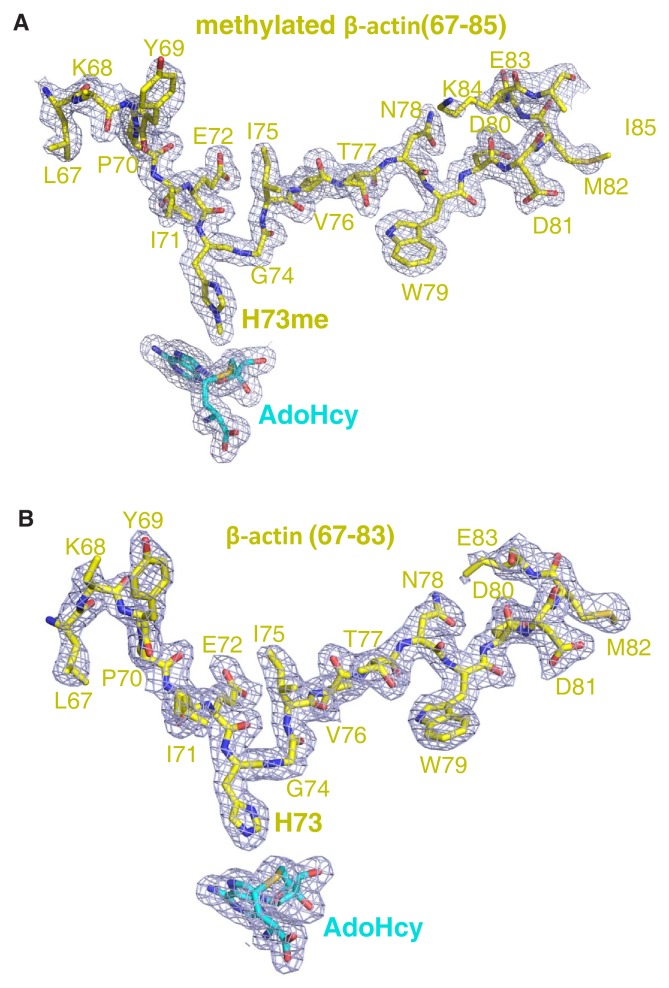
Figure 1—figure supplement 5. The 2|Fo|–|Fc| σ-weighted maps of peptide and AdoHcy.

Figure 1—figure supplement 5.

The 2|Fo|–|Fc| σ-weighted maps of (A) methylated β-actin peptide and (B) unmodified β-actin peptide in the presence of AdoHcy are contoured at 1.2 σ (blue cage). The peptides are shown in yellow sticks.
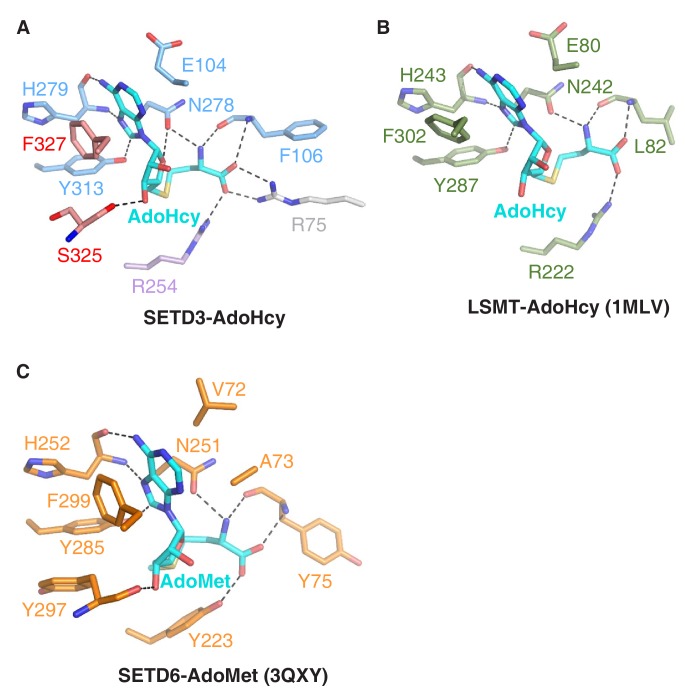
Figure 1—figure supplement 6. Comparison of AdoHcy's mode of binding to SETD3, LSMT or SETD6.

Figure 1—figure supplement 6.

(A) A detailed depiction of intermolecular interactions between SETD3 and AdoHcy, with AdoHcy shown in cyan sticks, and the AdoHcy binding residues of SETD3 shown in sticks and colored as in Figure 1A. (B) Detailed interactions between AdoHcy and LSMT (PDB id: 1MLV), with the binding residues of LSMT and AdoHcy shown in green and cyan sticks, respectively. (C) Detailed interactions between AdoMet and SETD6 (PDB id: 3QXY), with the binding residues of SETD6 and AdoMet shown in orange and cyan sticks, respectively. In Figure 2B and C, hydrogen bonds are indicated by black dashes.
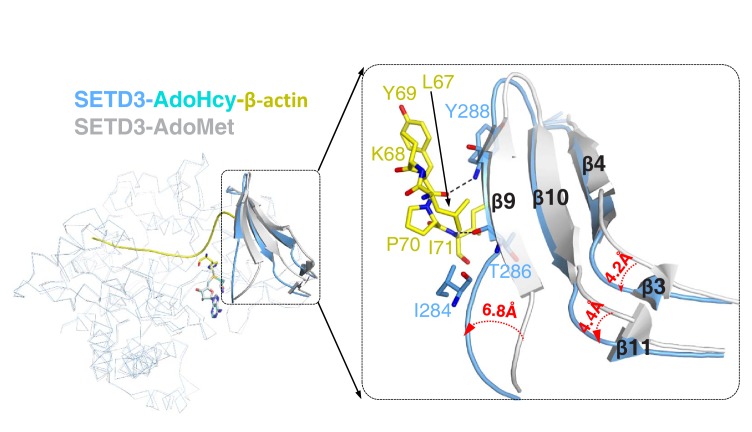
Figure 1—figure supplement 7. Superposition of AdoMet-bound SETD3 (PDB id: 3SMT) and AdoHcy-bound SETD3-actin.

Figure 1—figure supplement 7.

In the structure of AdoMet-bound SETD3, the protein is shown in a gray ribbon and AdoMet is shown in gray sticks. In the structure of AdeHcy-bound SETD3 in the presence of actin, the SETD3 protein is represented by a blue ribbon and AdoHcy is represented by yellow sticks. β4-β9-β10 and β3-β11 of SETD3 changed their conformations significantly upon binding to actin peptide, as is shown in cartoon representation. Leu67-Ile71 of β-actin and their interacting residues in SETD3 are represented by sticks. Three loops that precede β4, β9 and β11 shift 4.2 Å, 4.4 Å, and 6.8 Å, respectively.
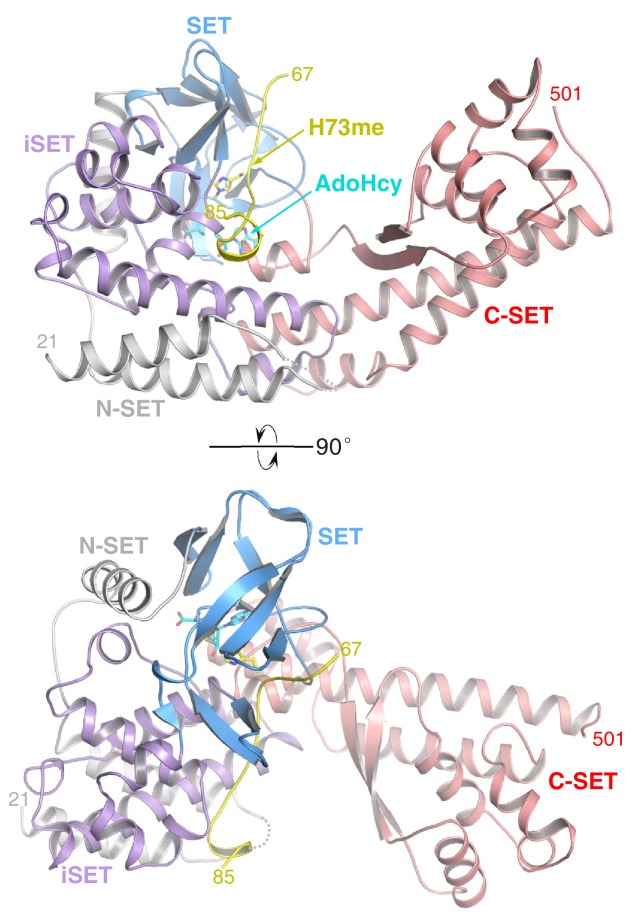
Figure 1—figure supplement 8. The overall structure of SETD3 with methylated β-actin peptide in the presence of AdoHcy.

Figure 1—figure supplement 8.

SETD3 is colored and labeled as in Figure 1C. AdoHcy and His73me are shown in sticks.