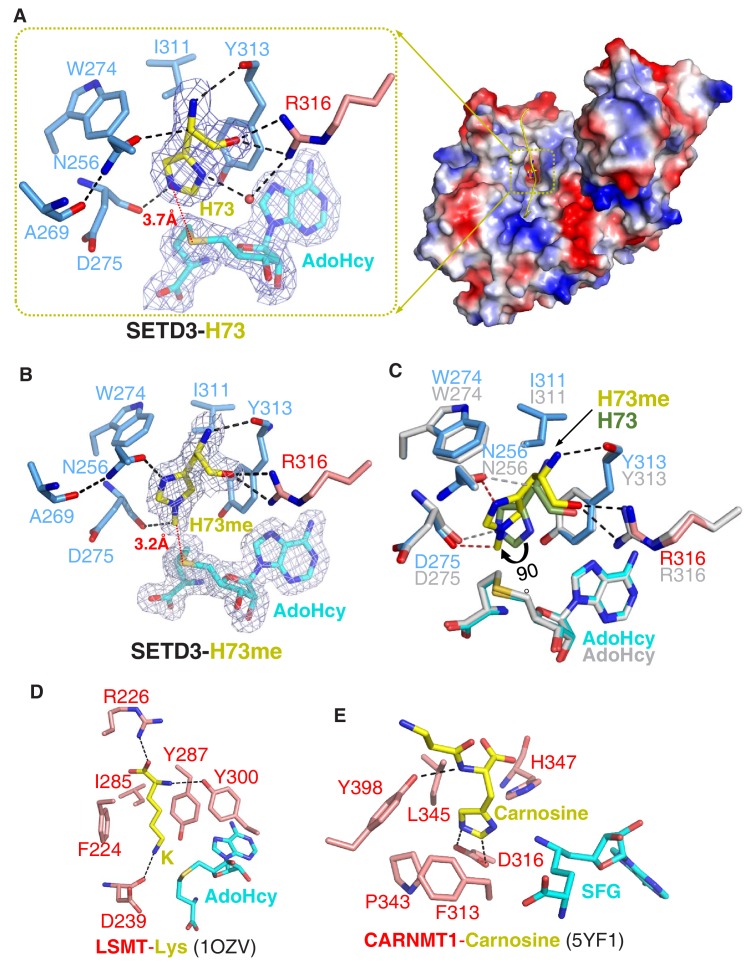
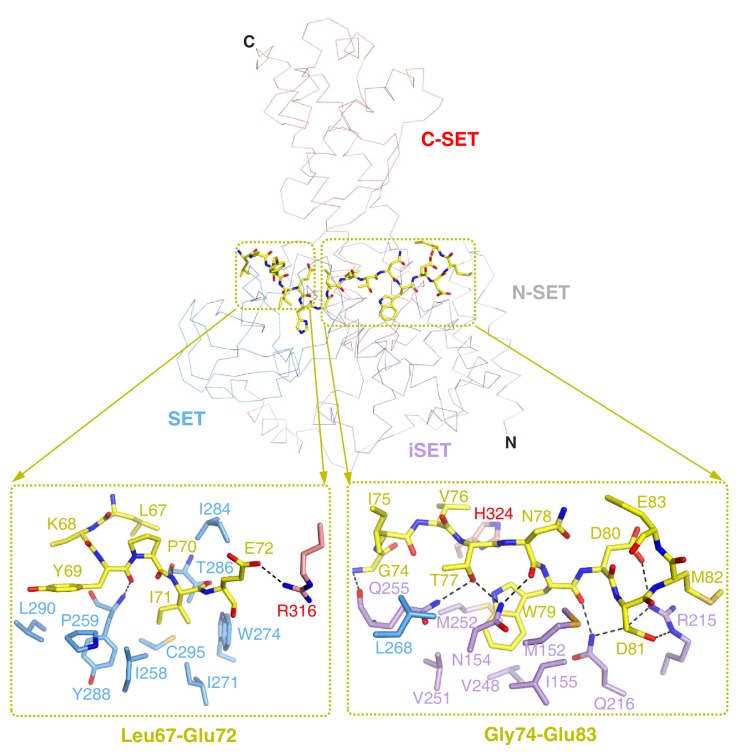
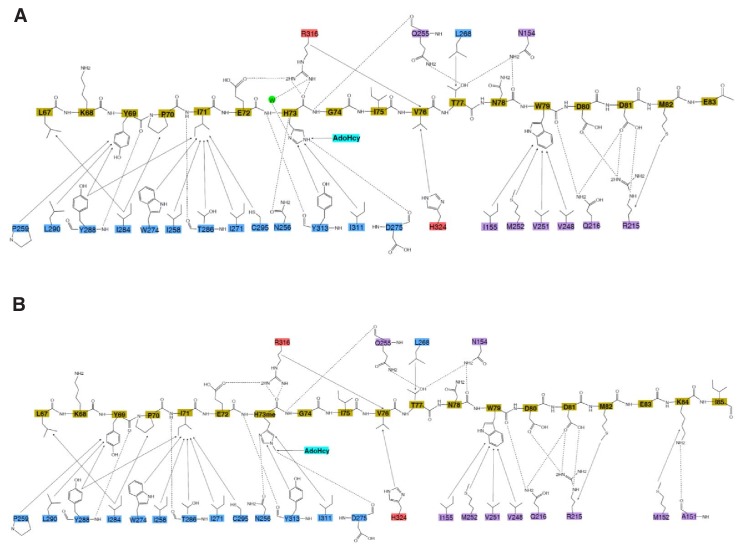
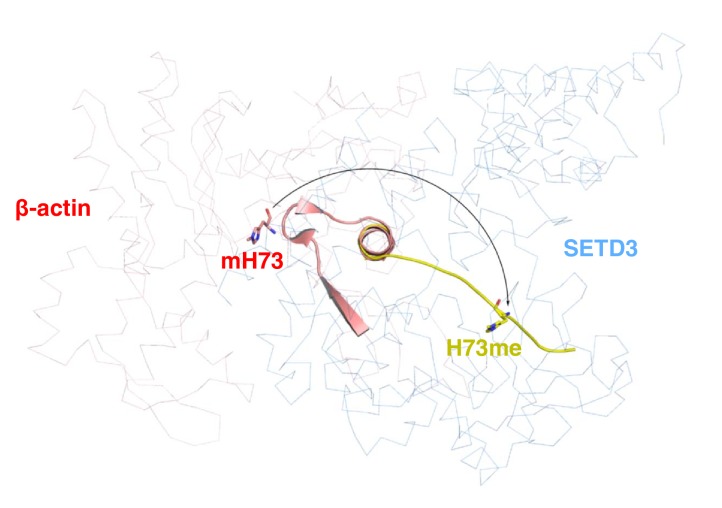
Figure 2. Molecular mechanism of substrate recognition and histidine methylation by SETD3.
(A) The β-actin peptide binds into a long groove on the surface of the SETD3 N-lobe region (right), with His73 of β-actin positioned into a hydrophobic pocket (left). His73 and AdoHcy are shown in yellow and cyan sticks, respectively, and their 2|Fo|–|Fc| σ-weighted maps are contoured at 1.2 σ. The His73-binding residues of SETD3 and are colored according to on regions in which they reside, as shown in Figure 1A. (B) Detailed interactions between His73me and SETD3 in the post- methyl transfer complex. His73me and AdoHcy are shown in yellow and cyan sticks, respectively, and their 2|Fo|–|Fc| σ-weighted maps are contoured at 1.2 σ. The His73me-binding residues of SETD3 are colored according to the scheme shown in Figure 2A. (C) Superposition of the two complexes on the histidine/methylhistidine binding pocket. For the SETD3–His73me complex, the His73me-binding residues of SETD3 are illustrated as in Figure 2A, with His73me and AdoHcy shown in yellow and cyan sticks, respectively. For the SETD3–His73 complex, the His73-binding residues and AdoHcy are shown in gray sticks, whereas His73 is shown in green sticks to show that it rotates 90 degrees after catalysis. After methylation, one new hydrogen bond is formed between Asn256 and the N1 atom of His73me (red dashed line). (D) Lysine recognition by LSMT(PDB id: 1OZV) in the presence of AdoHcy. (E) Carnosine recognition by CARNMT1 (PDB id: 5YF1) in the presence of the AdoHcy mimics SINEFUNGIN (SFG). Histidine, lysine and carnosine are shown in yellow sticks, whereas the protein residues that are involved in binding are shown in red sticks. AdoHcy and SFG are shown in cyan sticks.


