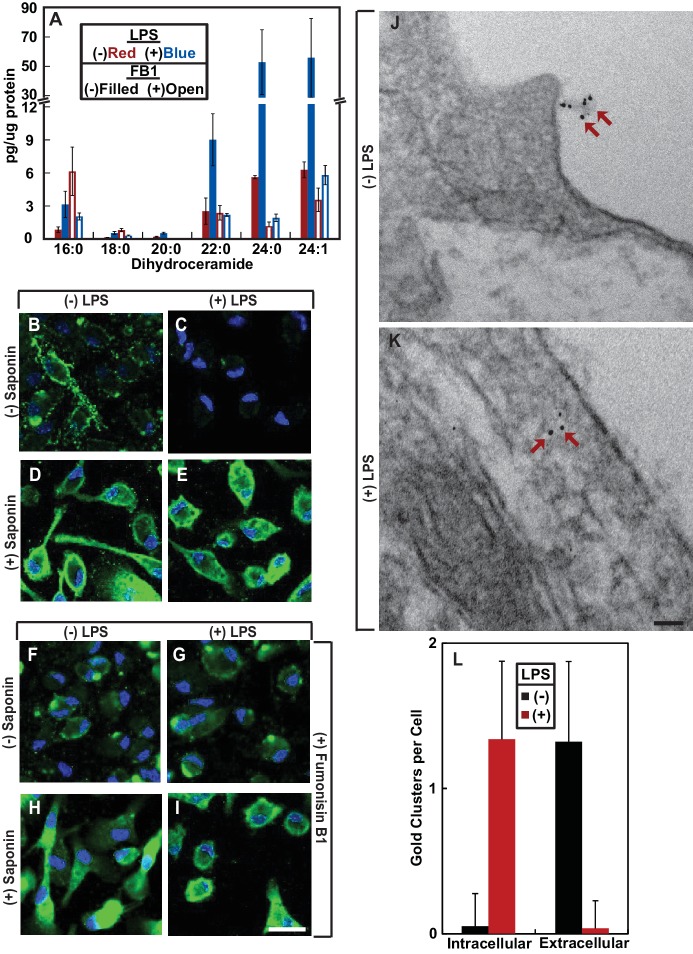
Figure 3. LPS induces RAT of CCR5 in primary mouse macrophages.
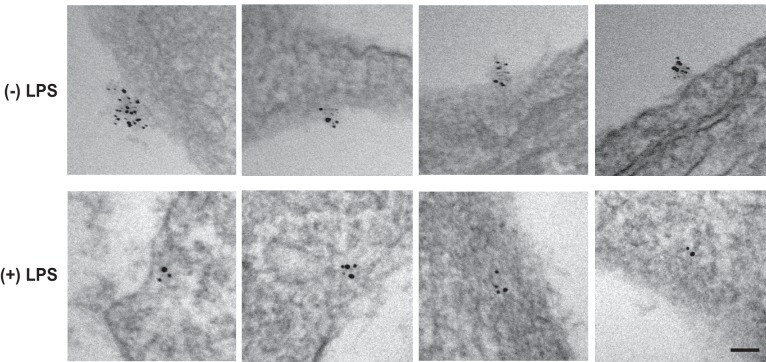
(A–I) Mouse macrophages were treated with or without 100 ng/ml LPS in the absence (B–E) or presence of 30 μM FB1 (F–I) for 16 hr. (A) The amount of dihydroceramide with the indicated amide-linked acyl chains in the cells was determined through LC-MS measurement. Results are reported as mean ±S.E. from three independent experiments. (B–I) Macrophages were subjected to immunofluorescent microscopy analysis with an antibody against the seoncd extracellular loop of CCR5(A) in the absence or presence of saponin-mediated cell permeabilization. Scale bar = 10 μm. (J and K) Macrophages treated without (J) or with (K) 100 ng/ml LPS for 24 hr were subjected to immuno-gold EM analysis with an antibody against the N-terminal domain of CCR5. Scale bar = 200 nm. (L) The number of intracellular and extracellular-localized CCR5 labeled by gold clusters per cell was quantified from macrophages treated with (n = 20) and without LPS (n = 28). The results are reported as mean ±S.D. This number should be smaller than that of CCR5 molecules, as it did not include CCR5 labeled by a single gold particle, the specificity of which was difficult to determine.
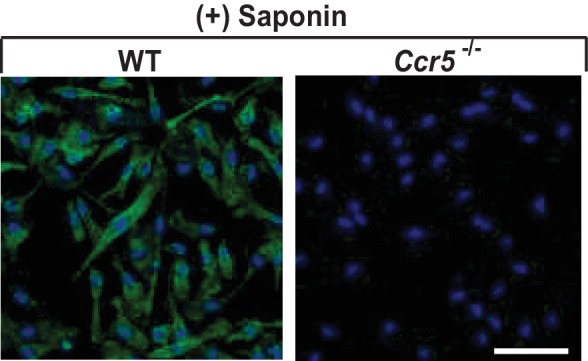
Figure 3—figure supplement 1. The specificity of CCR5 immunofluorescent microscopy.

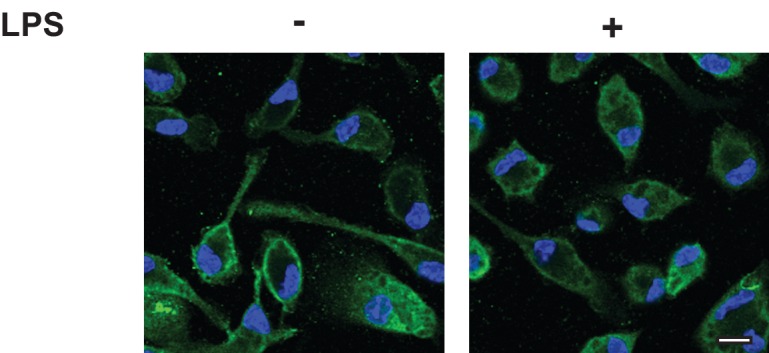
Figure 3—figure supplement 2. CCR5 is localized on cell surface regardless of LPS treatment.


