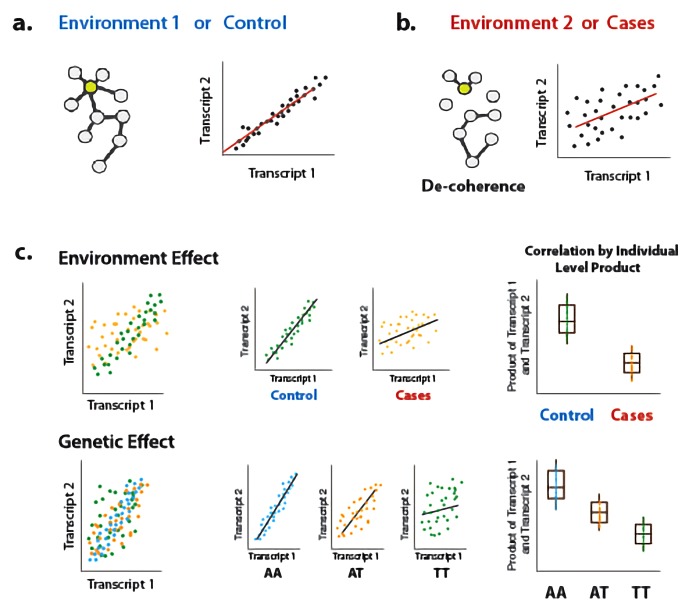
Figure 1. Illustration of decoherence and ‘Correlation by Individual Level Product’ (CILP).
(a) Co-expression networks in two different environments. Environment one represent normal (or control/baseline) conditions where the expression levels of gene 1 and gene 2 are highly correlated and co-regulated. (b) Environment 2 represents a stressful or unhealthy condition leading to lower correlation between the expression levels of gene 1 and gene 2. At the network level, this translates into a lower network degree (i.e., lower average correlation across genes or fewer connected nodes). We call this change in the correlation structure 'decoherence'. This is what we could expect if stressful conditions lower transcriptional robustness and lead to dysregulation of gene expression. (c) Differences in correlation between the expression levels of gene 1 and gene 2 in cases versus controls, or between genotypes, which translates into an average difference in product between these groups.


