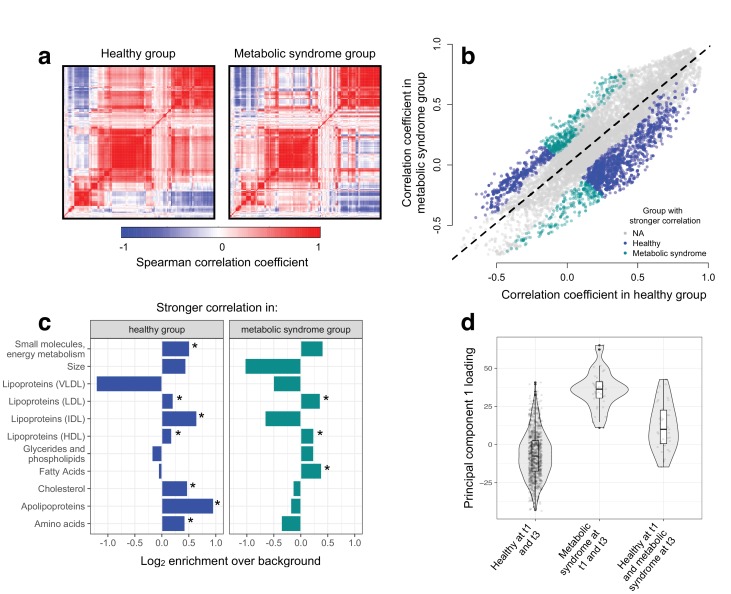
Figure 3. Metabolic syndrome leads to decoherence among particular metabolite pairs.
(a) Correlation matrices showing the magnitude of the Spearman correlation coefficient, for healthy individuals and those with metabolic syndrome. (b) Comparison of the Spearman correlation coefficient estimated in healthy individuals (x-axis) versus those with metabolic syndrome (y-axis). Overall, the magnitude of the correlation is similar between groups (R2 = 0.62, p<10−16), though the slope of the line is already less than 1, indicating a tendency toward stronger correlations in healthy individuals (beta = 0.814). For the subset of metabolite pairs that display significantly stronger correlations in the healthy (blue dots) or metabolic syndrome class (green dots), this effect is more pronounced (beta = 0.597). (c) Categorical enrichment of metabolites that exhibit stronger pairwise correlations in the healthy or metabolic syndrome class (x-axis: log2 odds ratio from a Fisher’s exact test; y-axis: 11 functional classes tested (annotations taken from (Nath et al., 2017)). Asterisks indicate significant enrichment. (d) A composite measure of metabolites that are strongly decoherent at the first time point (i.e., that show decreases in correlation in individuals with metabolic syndrome) can predict an individual’s future health status. Y-axis: Principal component 1 of 34 metabolites, measured at the first time point, with the strongest evidence for dysregulation. X-axis: values are stratified by whether an individual was healthy at the first (t0) and the last (t3) time point, had metabolic syndrome at t0 and t3, or developed metabolic syndrome between t0 and t3 (linear model, p=3.03×10⁻¹⁰).


