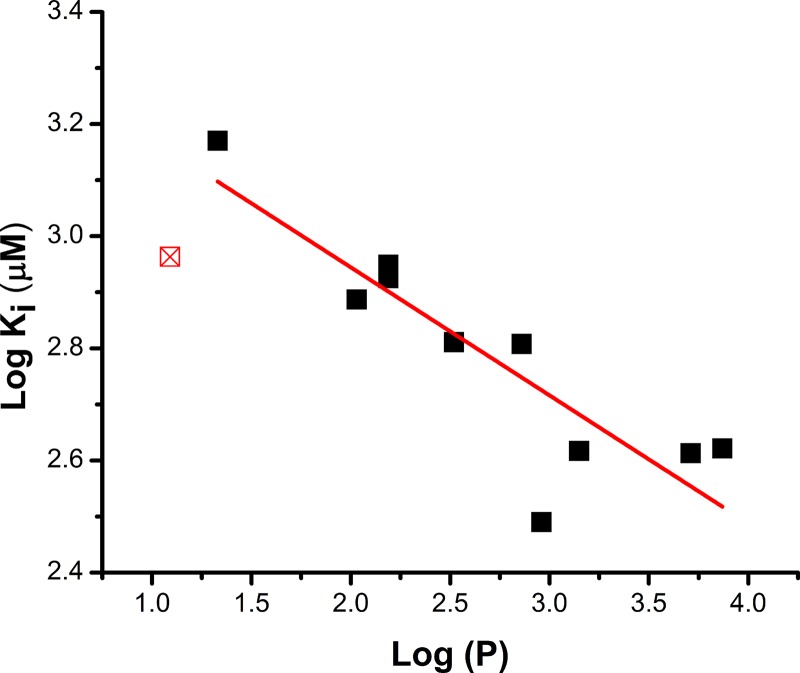
Figure 5.
Inhibitor affinity correlates with the hydrophobicity of the hydrocarbon side chain. Log(Ki) is plotted as a function of log(P) of the side chain. Log(P) was calculated according to (Petrauskas and Kolovanov, 2000). R2 for the linear regression (solid line) is 0.74. Pearson’s r value is −0.88, indicating good correlation. Compound 2b was excluded from the fit (red square) because of borderline substrate-like properties.

