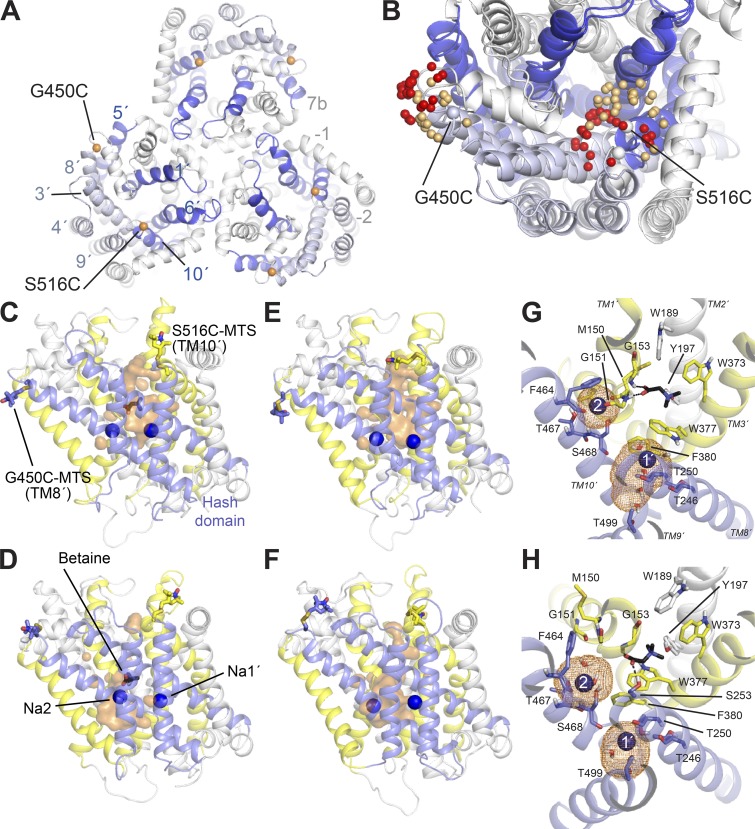
Figure 1.
Structure of BetP and spin-label locations. (A and B) The structure of BetP shown as cartoon helices, highlighting TM helices 1′, 5′, 6′, and 8′ lining the substrate pathway (blue) and helices 3′, 4′, 8′, and 9′ in the hash domain (pale blue). Helices −2, −1, and 7b (white) contribute to the trimer interface. Each BetP protein chain was labeled at two cysteines on the periplasmic surface, introduced at positions G450 and S516. (A) Trimer structure of BetP (PDB accession no. 4C7R). Cα atoms of labeled positions are shown as orange spheres. (B) Comparison of MMM-based predicted spin-label positions in structures of the two extreme conformations of monomeric BetP, outward-open (PDB accession no. 4LLH, chain A) or inward-open (PDB accession no. 4C7R, chain A), with nitroxide N atom positions colored red and gold, respectively. (C–F) Simulation system for spin-labeled monomeric BetP. Snapshots indicate the location of the spin labels with betaine bound (C and D) or without betaine (E and F), in either outward-open (C and E) or inward-open (D and F) conformations. The protein is viewed from within the plane of the membrane. The MTS labels and bound betaine are shown as sticks, and sodium ions are shown as blue spheres. Representative snapshots were selected from the center of a cluster of conformations in which the probe distance is at the peak of the distribution (∼42 Å or ∼27 Å for the betaine-bound or betaine-free systems, respectively). Water molecules within 10 Å of the ligand are shown as an orange surface, highlighting the pathways on the extracellular or intracellular sides. Helices 3′, 4′, 8′ (including G450C), and 9′, which comprise the so-called hash domain, are colored blue. Helices 1′, 5′, 6′, and 10′ (including S516C) are colored yellow. Lipids and surrounding solvent are omitted for clarity. (G and H) Sodium ion binding sites (Na1′ and Na2, labeled 1′ and 2, respectively) in the outward- (G) and inward-open (H) conformations of BetP in the presence of substrate, viewed from the extracellular side. The density occupied by each ion during the EBMetaD simulations is shown as orange mesh. Nearby water molecules are shown in stick representation.

