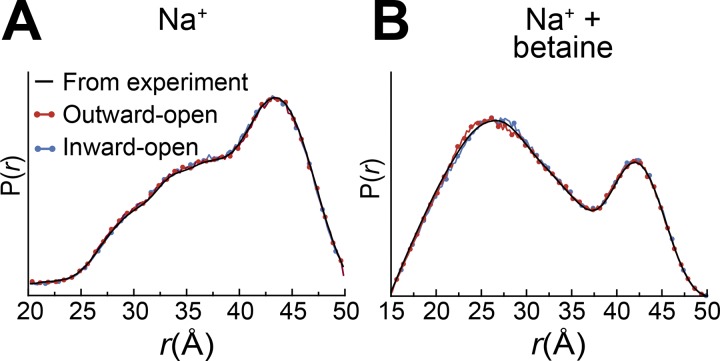
Figure 3.
Convergence of simulated to experimental distance distributions. The probability of a distance P(r) is plotted versus distance (r). The PELDOR-based distances (black lines), measured in the presence of 500 mM NaCl (A) or 300 mM NaCl plus 5 mM betaine (B), are compared with distances obtained in 1-µs-long EBMetaD MD simulations, performed for BetP monomers in the presence of two sodium ions (A) or with two sodium ions plus a betaine substrate (B). The simulations were started with BetP structures of either outward-facing (PDB accession no. 4LLH chain A, red circles) or inward-facing (PDB accession no. 4C7R, blue circles) conformations.

