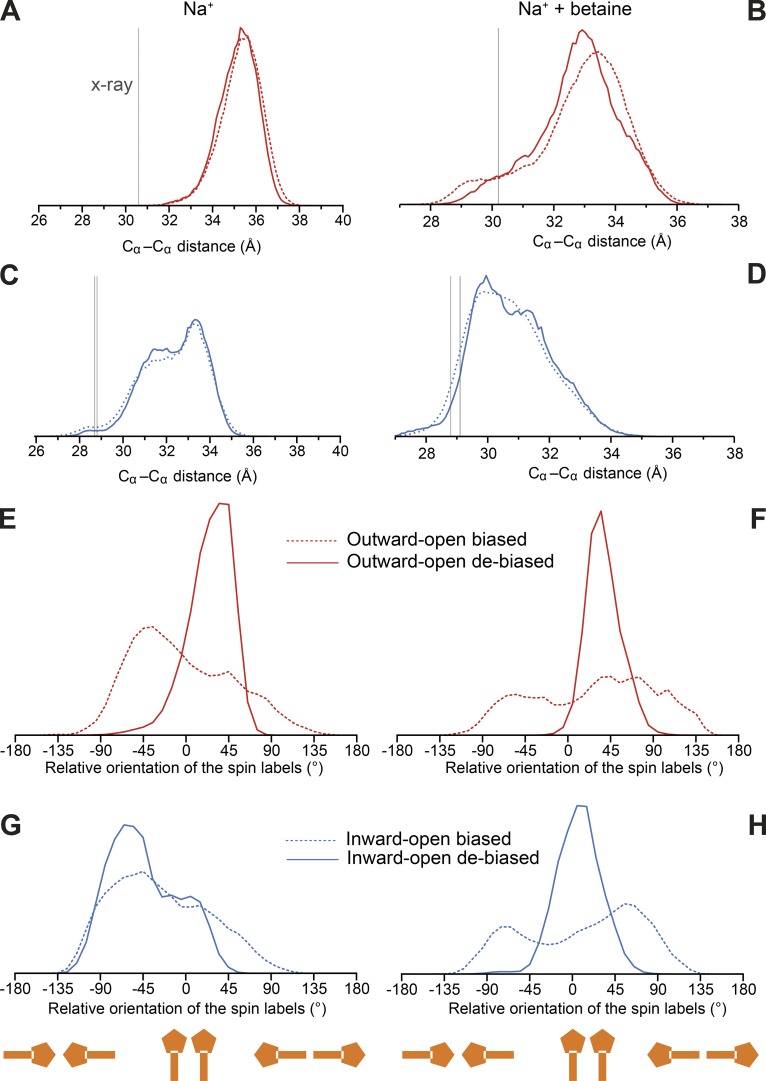
Figure 8.
Analysis of backbone distances and spin-label orientations. Distributions of Cα–Cα atom distances (A–D) and spin-label side chain orientations calculated for the biased trajectories (dashed lines) and after de-biasing those same trajectories (solid lines; E–H). Simulations were performed with two sodium bound (left panels) or with two sodium ions plus one betaine molecule bound (right panels). Data were obtained for simulations of BetP in outward- (PDB accession no. 4LLH chain A, red), or inward-open conformations (PDB accession no. 4C7R, blue). (A–D) Reference x-ray structure data (vertical gray lines) are taken from Table S2. (E–H) The angle was computed between the axes connecting the backbone Cα and nitroxide N atoms in each spin label; negative numbers indicate that the probe rings point toward one another, whereas positive numbers indicate that the probes are oriented in opposite directions.

