Figure 2.
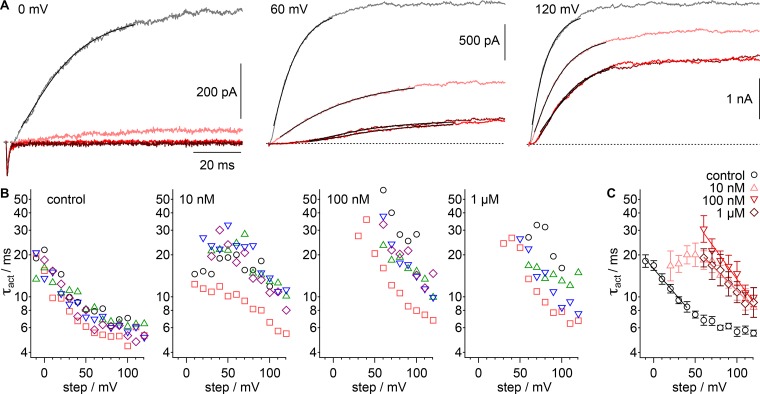
GxTx slows Kv2.1 activation kinetics in whole-cell recordings. (A) Example current from a voltage clamped cell in response to indicated voltage steps. Gray, vehicle; pink, 10 nM GxTx; red, 100 nM GxTx; dark red, 1 µM GxTx. Inward current at 0 mV is endogenous sodium current. Dotted lines, zero current level. Lines, fit of Eq. 3 (0 mV vehicle: A = 454.7 ± 0.5 pA, τact = 16.29 ± 0.06 ms, σ =1.915 ± 0.008; 60 mV vehicle: A = 1,841 ± 1 pA, τact = 8.34 ± 0.03 ms, σ = 1.373 ± 0.004; 60 mV 10 nM GxTx: A = 868 ± 1 pA, τact = 25.1 ± 0.1 ms, σ = 1.299 ± 0.004; 60 mV 100 nM GxTx: A = 293 ± 1 pA, τact = 21.4 ± 0.1 ms, σ = 3.89 ± 0.03; 60 mV 1 µM GxTx: A = 319 ± 1 pA, τact = 18.7 ± 0.1 ms, σ = 4.03 ± 0.05; 120 mV vehicle: A = 3,216 ± 4 pA, τact = 6.61 ± 0.04 ms, σ = 1.127 ± 0.006; 120 mV 10 nM GxTx: A = 2,640 ± 2 pA, τact = 10.23 ± 0.03 ms, σ = 1.367 ± 0.003; 120 mV 100 nM GxTx: A = 1,971 ± 2 pA, τact = 10.06 ± 0.04 ms, σ = 2.203 ± 0.009; 120 mV 1 µM GxTx: A = 2,256 ±4 pA, τact = 15.79 ± 0.08 ms, σ = 1.489 ± 0.006). (B) Values of τact from fitting of Eq. 3. Symbols denote individual cells. (C) Geometric mean of τact from cells in B. Black circles, control; pink triangles, 10 nM GxTx; red inverted triangles, 100 nM; dark red diamonds, 1 µM. Lines, fit of Eq. 8 (vehicle: τ0mV = 15.9 ± 0.3 ms, z = 0.41 ± 0.03 e0; 10 nM τ0mV = 43 ± 11 ms, z = 0.35 ± 0.07 e0; 100 nM τ0mV = 91 ± 14 ms, z = 0.49 ± 0.05 e0; 1 µM τ0mV = 44 ± 3 ms, z = 0.35 ± 0.02 e0).

