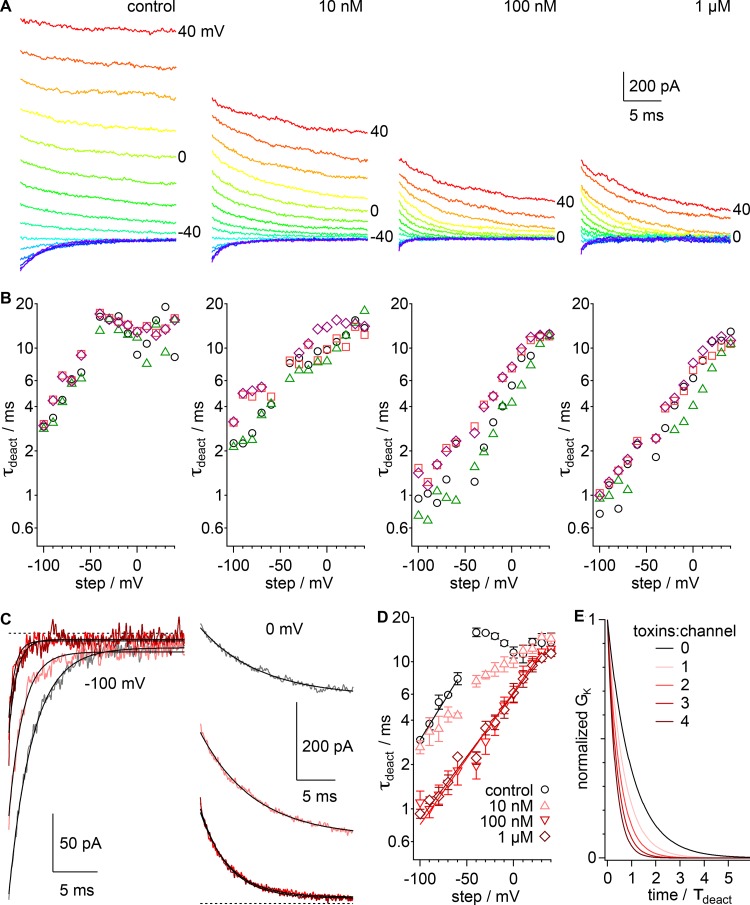
Figure 4.
GxTx accelerates Kv2.1 deactivation kinetics in whole-cell recordings. (A) Current in response to a series of voltage steps from +40 mV down to −100 mV in −10-mV increments following a 50-ms prepulse to +80 mV. Current recorded in indicated concentration of GxTx. Voltage stimuli colored identically in all panels. (B) Values of τdeact from fits of Eq. 4. Symbols denote individual cells. (C) Deactivation current response to voltage steps from −80 mV down to −100 or 0 mV. Gray, vehicle; pink, 10 nM GxTx; red, 100 nM; dark red, 1 µM. Dotted lines, zero current level. Lines, fit of Eq. 4 (−100 mV vehicle: A = −210.8 ± 0.4 pA, B = −12.3 ± 0.1 pA, τdeact = 2.67 ± 0.01 ms; −100 mV 10 nM: A = −140.4 ± 0.7 pA, B = −15.6 ± 0.1 pA, τdeact = 1.60 ± 0.01 ms; −100 mV 100 nM: A = −66 ± 1 pA, B = −6.4 ± 0.1 pA, τdeact = 0.69 ± 0.02 ms; −100 mV 1 µM: A = −80 ± 1 pA, B = −5.1 ± 0.1 pA, τdeact = 0.91 ± 0.02 ms; 0 mV vehicle: A = 176.1 ± 0.5 pA, B = 531.3 ± 0.6 pA, τdeact = 7.75 ± 0.07 ms; 0 mV 10 nM: A = 267.6 ± 0.5 pA, B = 171.4 ± 0.5 pA, τdeact = 6.96 ± 0.04 ms; 0 mV 100 nM: A = 217.6 ± 0.5 pA, B = 16.5 ± 0.2 pA, τdeact = 3.72 ± 0.02 ms; 0 mV 1 µM: A = 229.1 ± 0.5 pA, B = 13.8 ± 0.2 pA, τdeact = 3.55 ± 0.02 ms). (D) Geometric mean of τdeact from cells in B. Black circles, control; pink triangles, 10 nM GxTx; red inverted triangles, 100 nM; dark red diamonds, 1 µM. Lines, fit of Eq. 8 (vehicle: τ0mV = 31 ± 2 ms, z = −0.60 ± 0.02 e0; 100 nM: τ0mV = 6.2 ± 0.2 ms, z = −0.53 ± 0.02 e0; 1 µM τ0mV = 6.1 ± 0.1 ms, z = −0.50 ± 0.02 e0). (E) Deactivation curves calculated from Eq. 4 when τdeact is varied. Calculation for four independent deactivation gates closing with rate kgate where τdeact = (kgate1 + kgate2 + kgate3 + kgate4). Toxin binding accelerates kgate fourfold.

