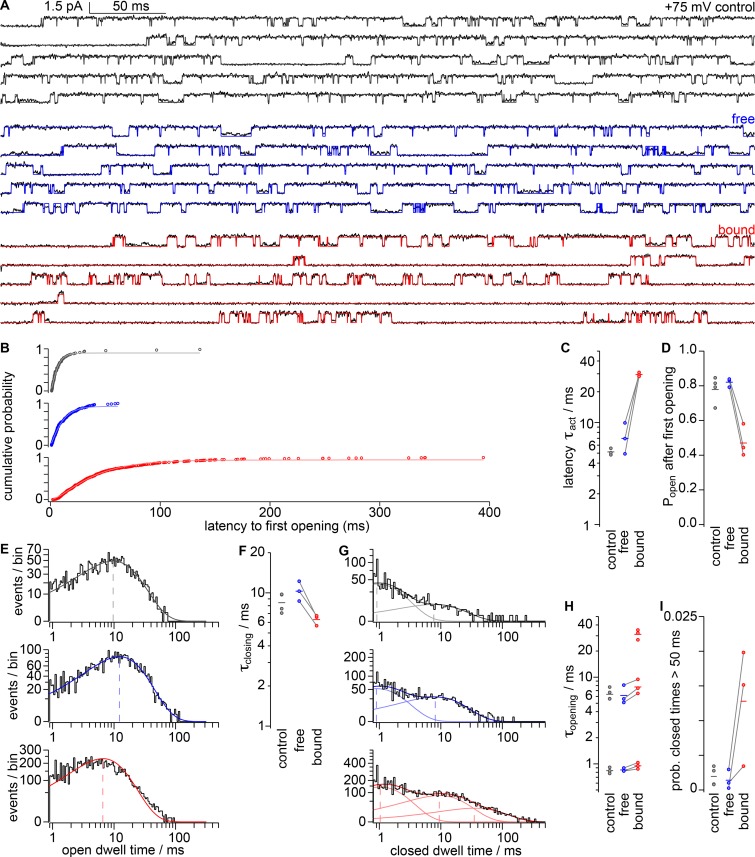
Figure 6.
GxTx stabilizes long-lived closed states of Kv2.1. (A) Gray, blue, and red lines: idealized single-channel traces during the +75 mV segment of the voltage protocol in Fig. 5 A. Gray, control; blue, “free” with 1 µM GxTx; red, “bound” with 1 µM GxTx. (B) Cumulative probability of latencies to the first opening. Smooth lines, fits of Eq. 3 (control A = 0.934 ± 0.038 pA, τact = 5.14 ± 0.39 ms, σ = 1.95 ± 0.61; free A = 0.98 ± 0.03 pA, τact = 7.0 ± 2.5 ms, σ = 1.45 ± 0.24; bound A = 0.934 ± 0.006 pA, τact = 29.5 ± 1.3 ms, σ = 1.40 ± 0.29). (C) τact from first latencies to first opening as in B. Circles, individual patches; gray lines connect measurements from the same patch. Horizontal lines, geometric means. (D) Open probability after the first opening derived from idealized traces. Horizontal lines, arithmetic means. (E) Log-binned open dwell-time distributions and single exponential fits. y axis is square root scaling. Dashed lines indicate microscopic time constant of closing. (F) Microscopic time constant of closing from individual patches. Horizontal lines, geometric means. (G) Log-binned closed dwell-time distribution and multi-exponential fit from representative patches. Two exponential components for control and free traces, three exponential components for bound traces. Dashed lines indicate time constant of channel opening. (H) Time constants of channel opening from individual patches. Horizontal lines, geometric means. (I) Probability (prob.) of channel-closing events that are longer than 50 ms. Horizontal lines, arithmetic means.

