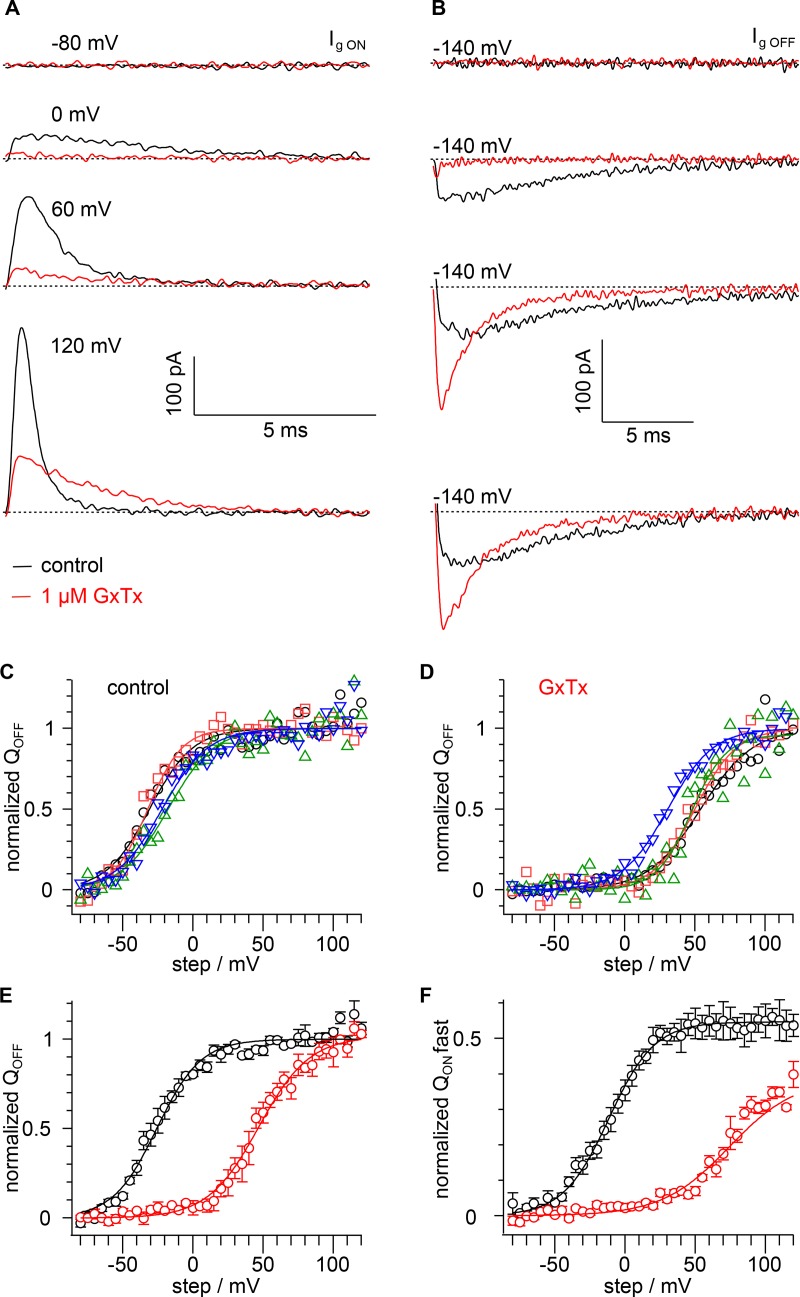
Figure 7.
GxTx inhibits outward gating-charge movement. (A) Ig ON elicited during voltage steps to the indicated potential from a holding potential of −100 mV. Black, vehicle; red, 1 µM GxTx; dotted lines, zero current level. (B) Ig OFF elicited during voltage steps to −140 mV following a 100-ms step to the potential indicated in A. (C) Integrals of control Ig OFF current following a 100-ms step to the indicated potential from individual cells (n = 3–4). (D) Integrals of 1 µM GxTx Ig OFF current following a 100-ms step to the indicated potential from individual cells (n = 3–4). Symbols mark same cells as in C. (E) Mean QOFF from C and D. Lines are fits of Eq. 5. Black, control; V1/2 = −26 ± 1 mV, z = 1.6 ± 0.1 e0; red, 1 µM GxTx V1/2 = 47 ± 1 mV, z = 1.4 ± 0.1 e0. (F) Integrals of Ig ON during the first 10 ms of a step normalized to the integral of Ig OFF to the indicated potential (n = 3–4). Lines are fits of Eq. 5. Black, control; V1/2 = −12 ± 3 mV, z = 1.6 ± 0.1 e0, A = 0.55 ± 0.02; red, 1 µM GxTx V1/2 = 74 ± 6 mV, z = 1.1 ± 0.1 e0, A = 0.39 ± 0.03.

