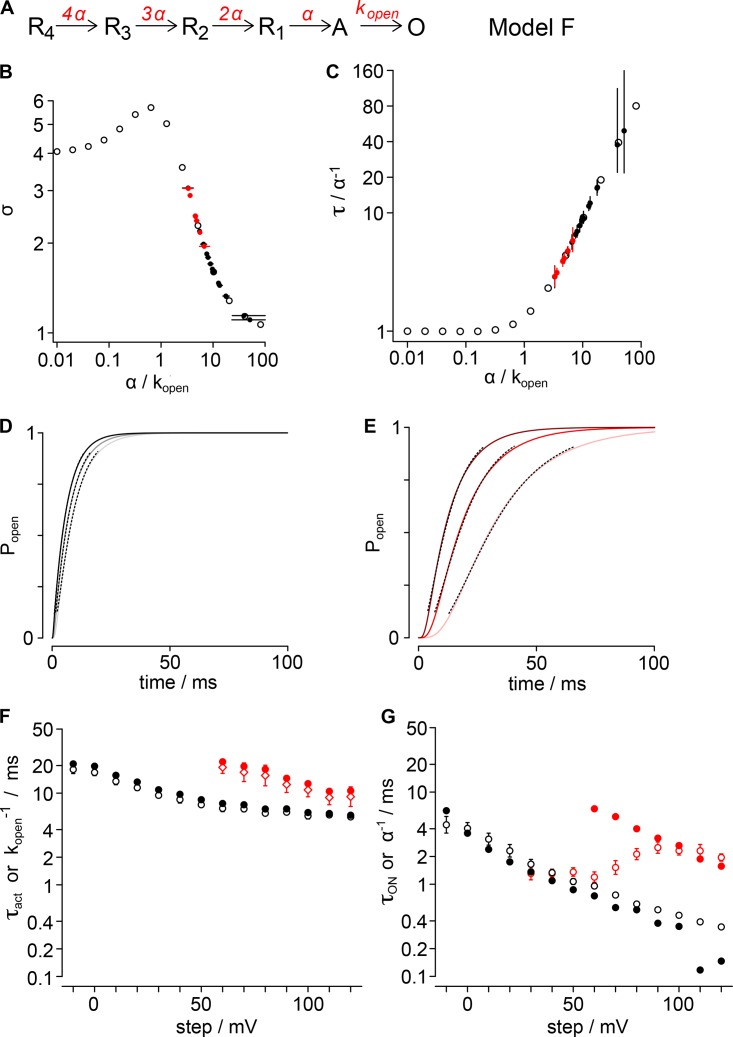
Figure 9.
Forward activation model (Model F). (A) Gating scheme for Model F activation. Four identical resting voltage sensors independently activate with rate α. Pore opening is modeled as a concerted event with rate kopen. Rates susceptible to GxTx are red. (B) Activation sigmoidicity, σ, is plotted for varying α/kopen ratios. Hollow black circles, σ from fit of Eq. 3 to simulations; filled circles, σ values of Kv2.1 experiments from Fig. 3 B, assigned to α/kopen ratios; black, vehicle; red, 1 µM GxTx. (C) The relation of τact to the reciprocal of α is plotted for varying α/kopen ratios. Hollow black circles, τact from fit of Eq. 3 to simulations; filled circles, τact values from Fig. 2 C, assigned to α/kopen ratios by σ in panel B; black, control; red, 1 µM GxTx. (D) Simulated Popen from Model F under control conditions. Light gray, 60 mV; dark gray, 90 mV; black, 120 mV. Dotted lines show fits of Eq. 3. τ60mV = 6.81 ± 0.01 ms, σ60mV =1.596 ± 0.003; τ90mV = 6.196 ± 0.008 ms, σ90mV = 1.326 ± 0.002; τ120mV = 5.502 ± 0.004 ms, σ120mV = 1.141 ± 0.001. (E) Simulated Popen from Model F with GxTx. Light pink, 60 mV; red, 90 mV; dark red, 120 mV. Dotted lines show fits of Eq. 3. τ60mV = 19.03 ± 0.01 ms, σ60mV = 3.036 ± 0.003; τ90mV = 12.35 ± 0.01 ms, σ90mV = 2.466 ± 0.004; τ120mV = 9.11 ± 0.01 ms, σ120mV = 1.958 ± 0.004. (F) Comparison of the reciprocal of kopen from Model F to τact from Kv2.1 experiments. Hollow circles or diamonds, mean τact from Fig. 2 C; filled circles, kopen−1 from model; black, control; red, 1 µM GxTx. (G) Comparison of the reciprocal of α from Model F to τON from Kv2.1 gating currents. Hollow circles, mean τON from Fig. 8 E; filled circles, α−1 from model; black, vehicle; red, 1 µM GxTx.

