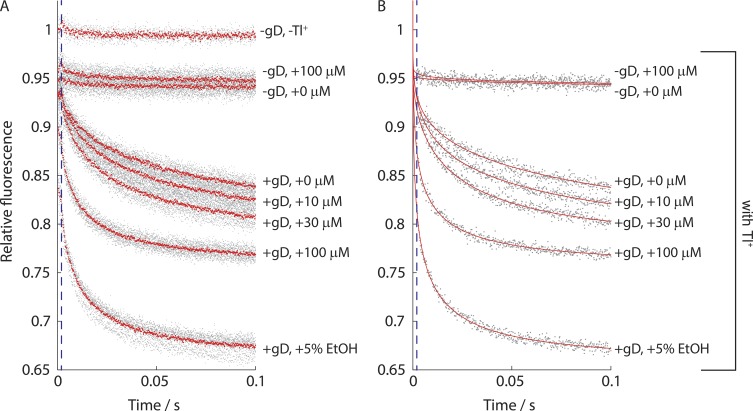
Figure 2.
Effect of fluoxetine (R−/S+) on the time course of ANTS fluorescence quenching. The gray dots represent individual experiments, with the data normalized to the maximum fluorescence in the absence of the quencher. (A) The red dots denote the average of the repeats for a given experimental condition. (B) The red line denotes a stretched exponential fit to each experiment. The blue stippled line demarcates 2 ms, where fluorescence quench rate was determined.

